Desert Housing Reports

September 2023 Desert Housing Report cover, featuring a palm-lined golf course and mountains.
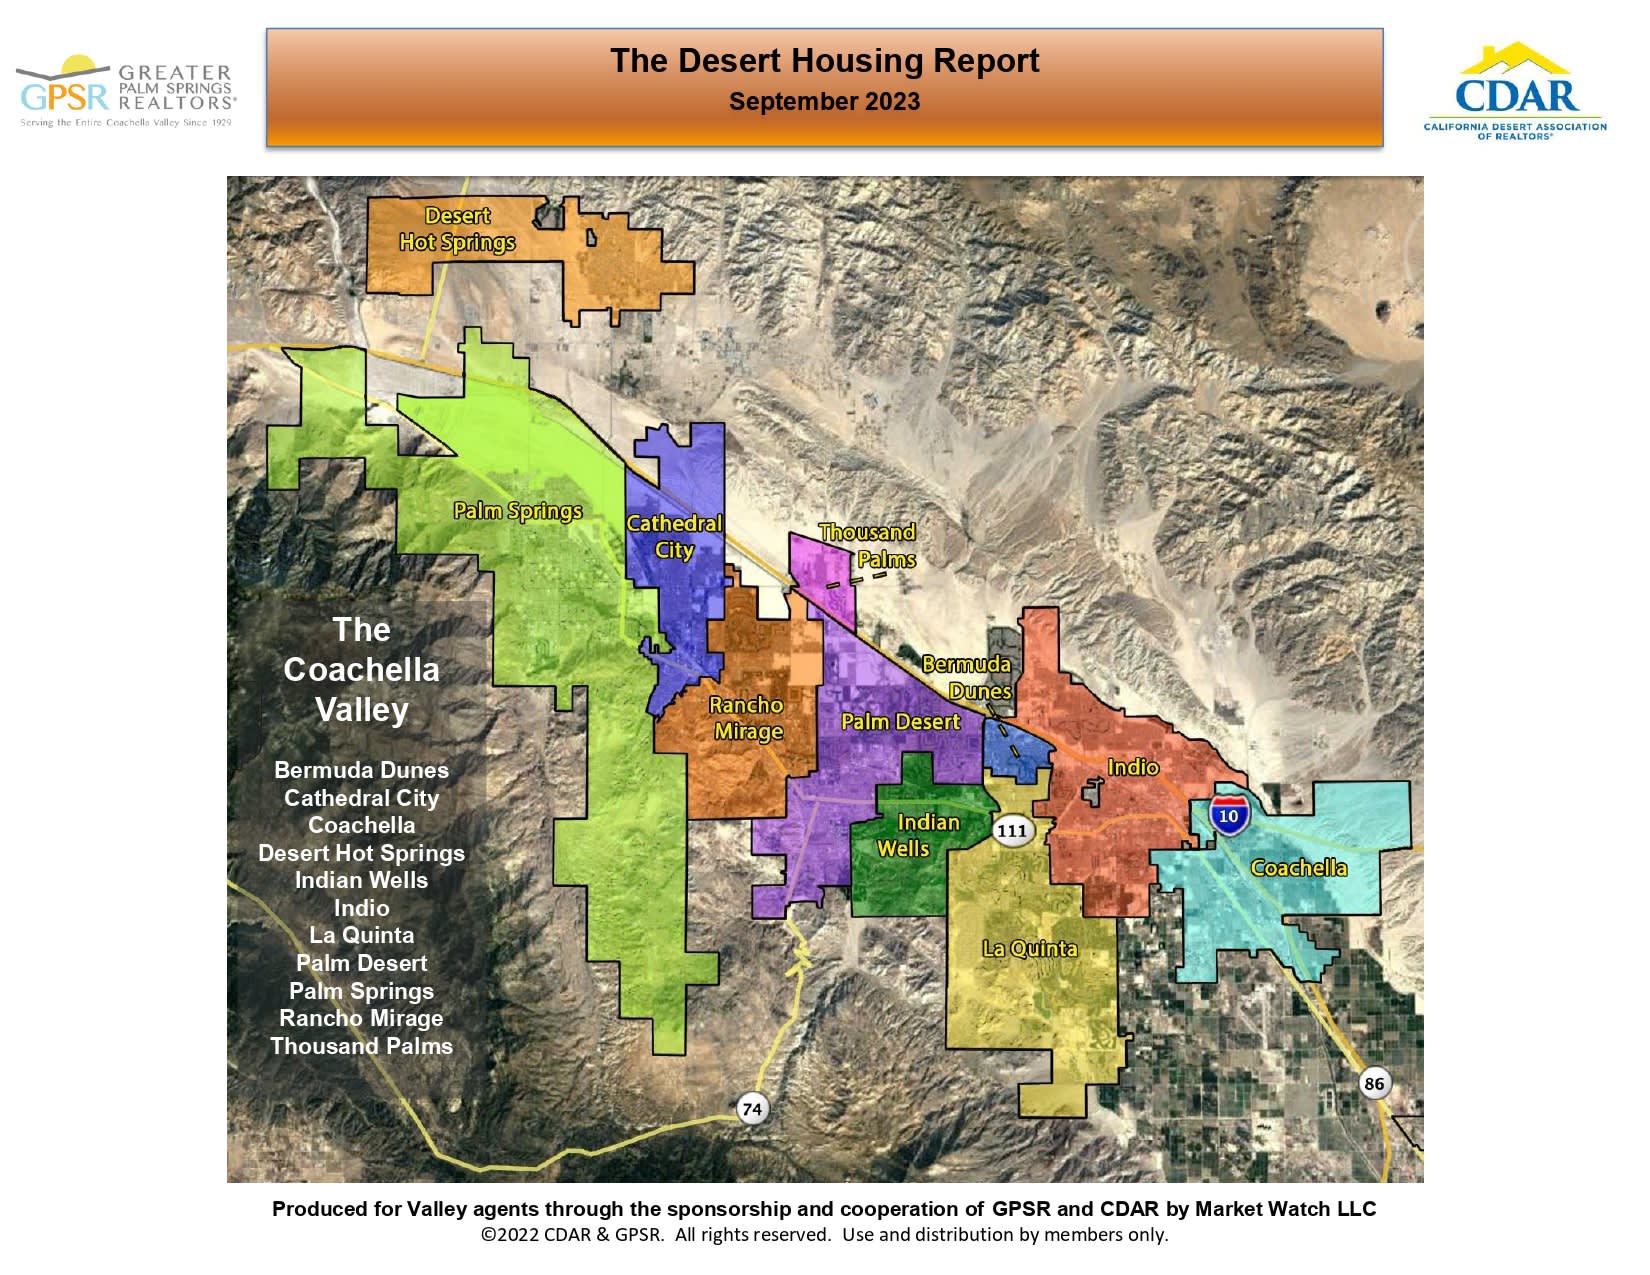
Map of the Coachella Valley showing color-coded boundaries for its desert cities.

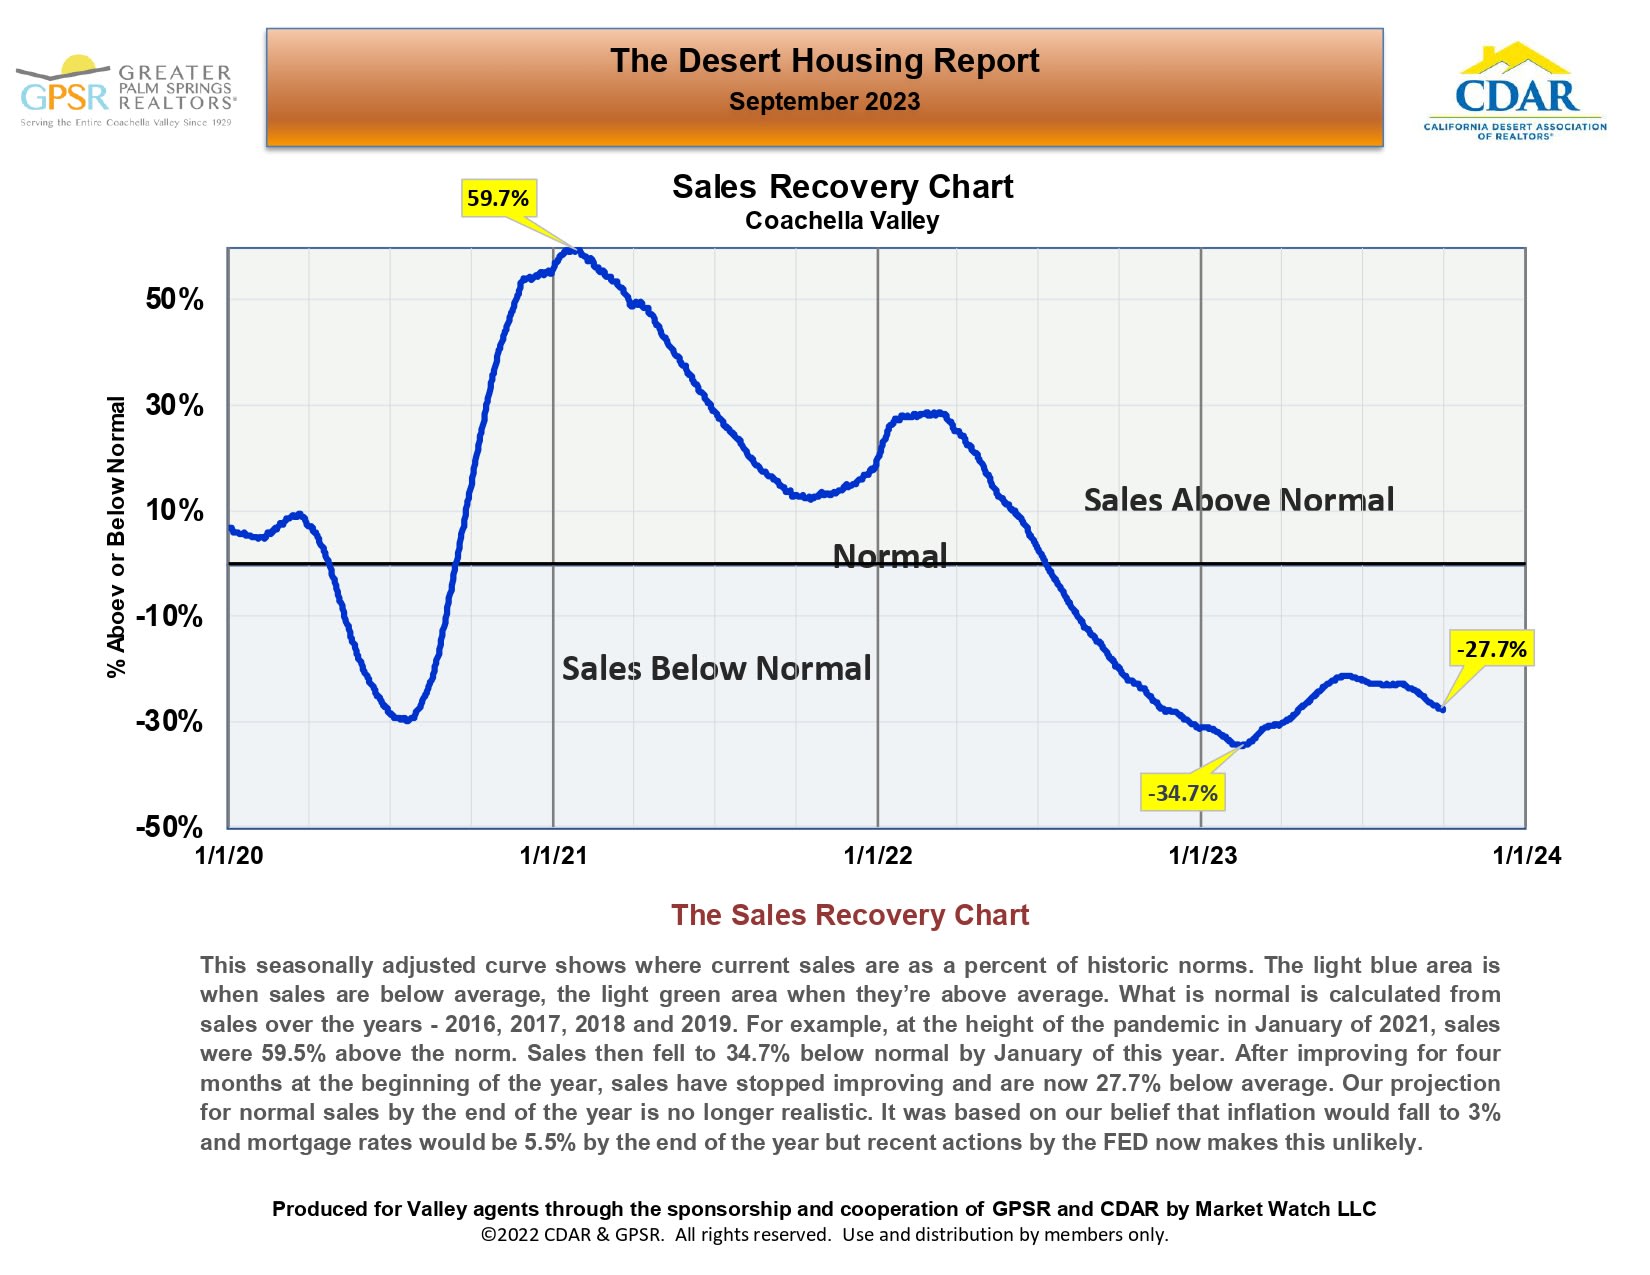
Coachella Valley sales recovery chart, showing sales falling from 59.7% above normal in 2021 to 27.7% below normal in 2023.

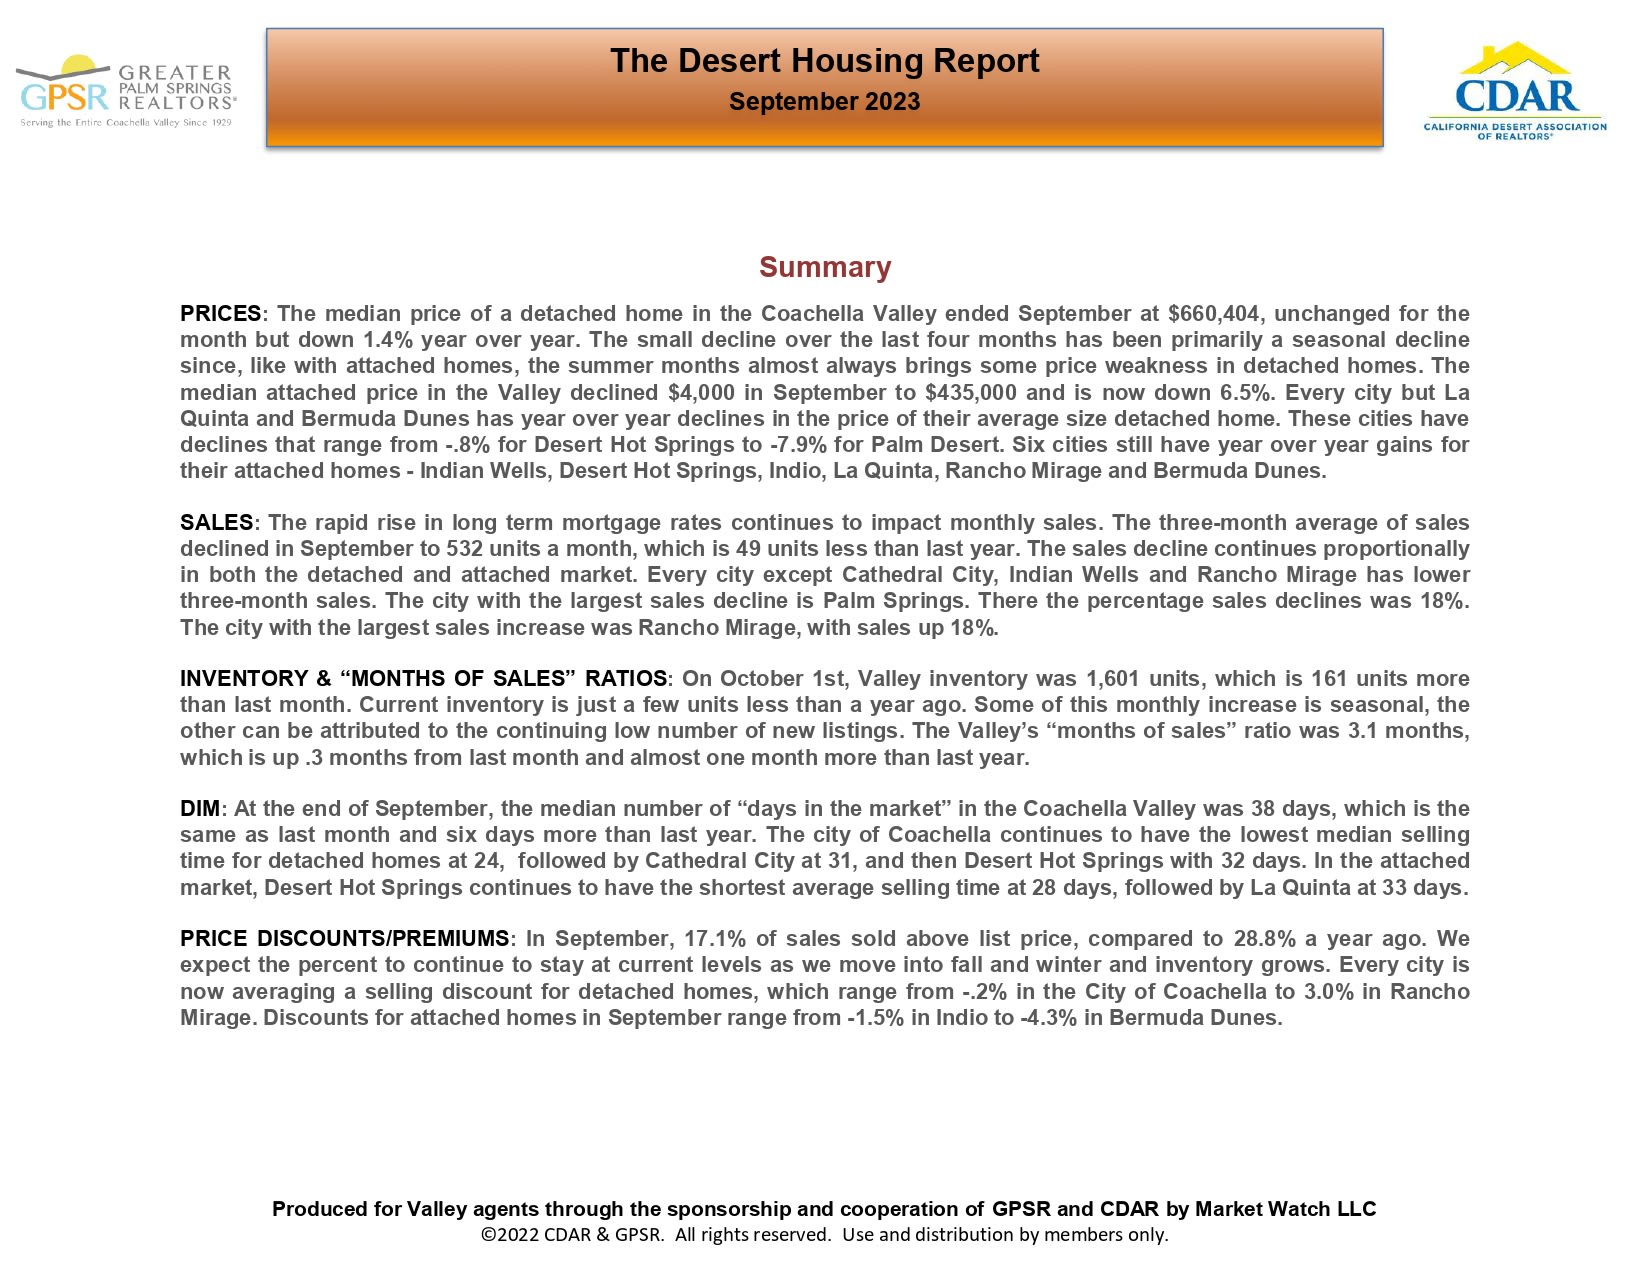
September 2023 Desert Housing Report summary of Coachella Valley prices, sales, inventory, days on market, and discounts.

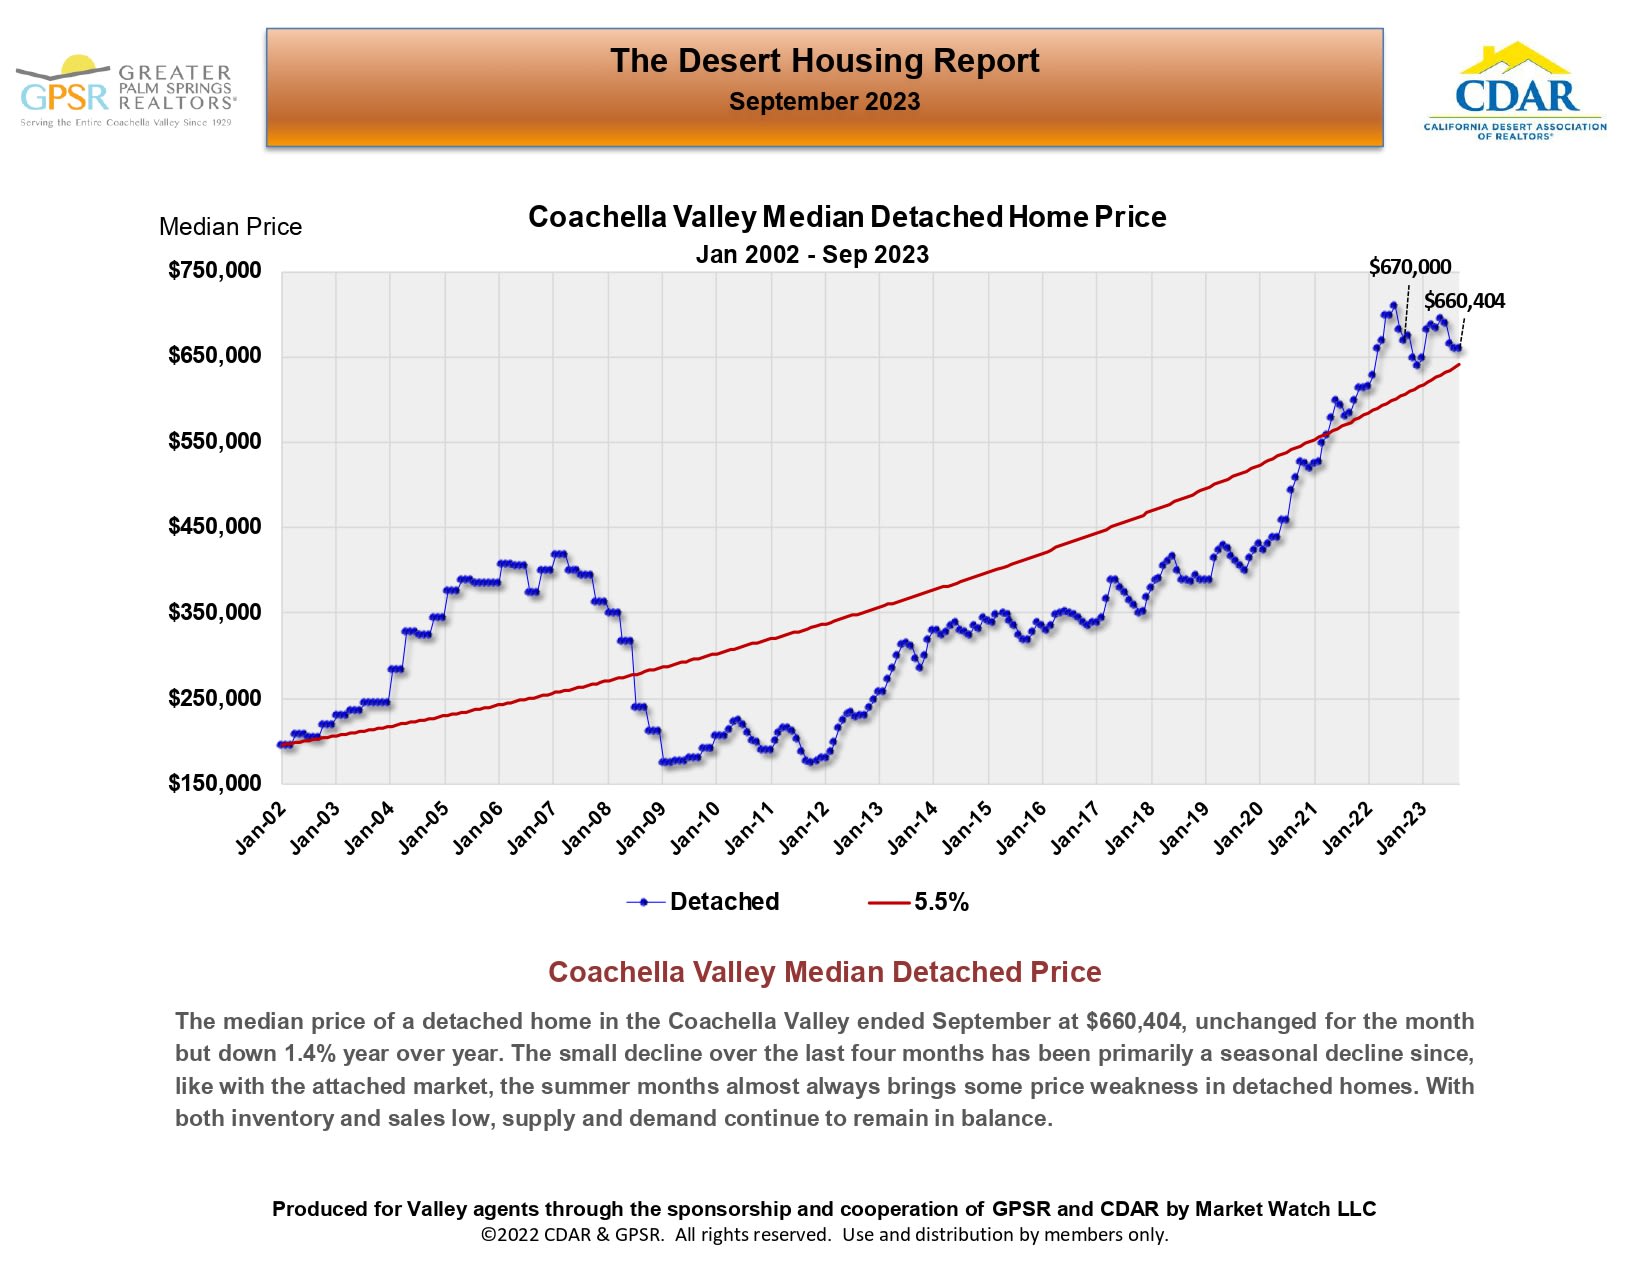
Chart of Coachella Valley detached-home median prices, January 2002–September 2023, ending at $660,404.

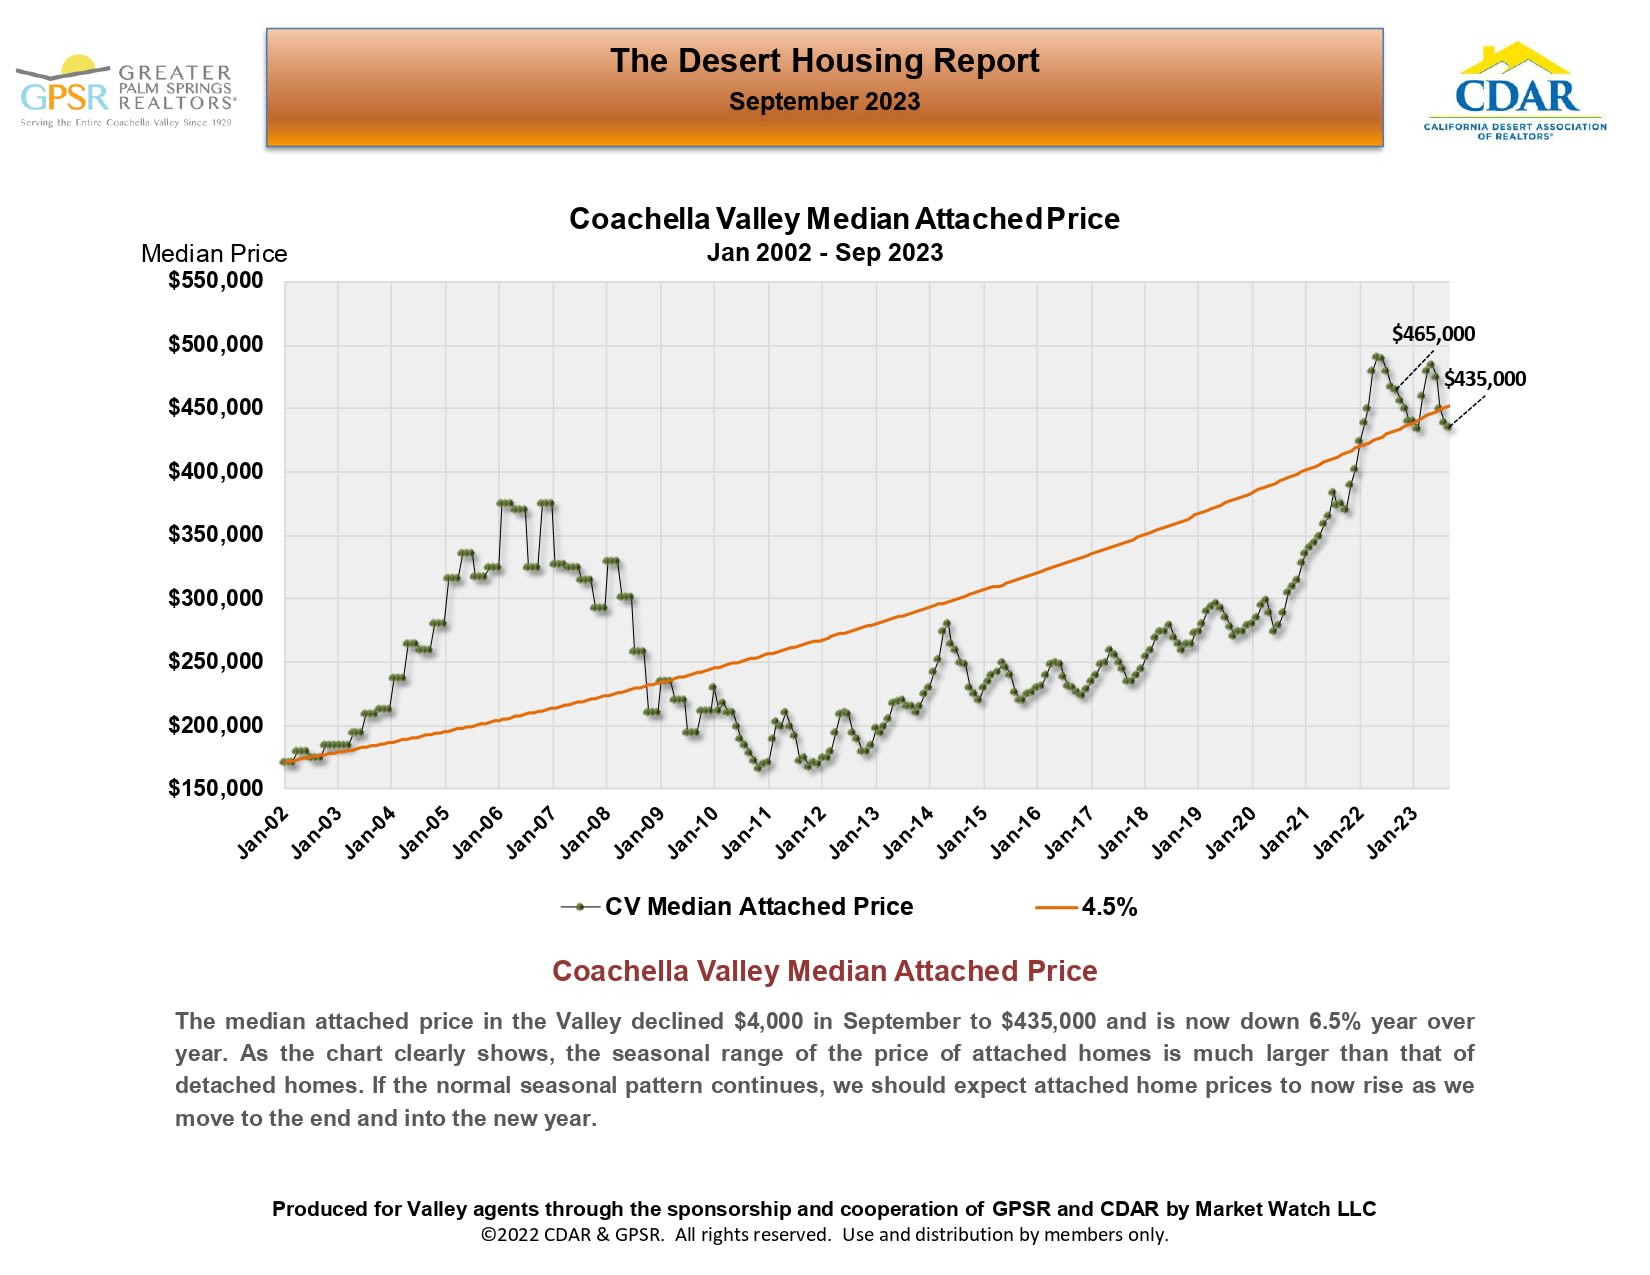
Chart of Coachella Valley median attached home prices from 2002 to 2023, ending at $435,000 in September.

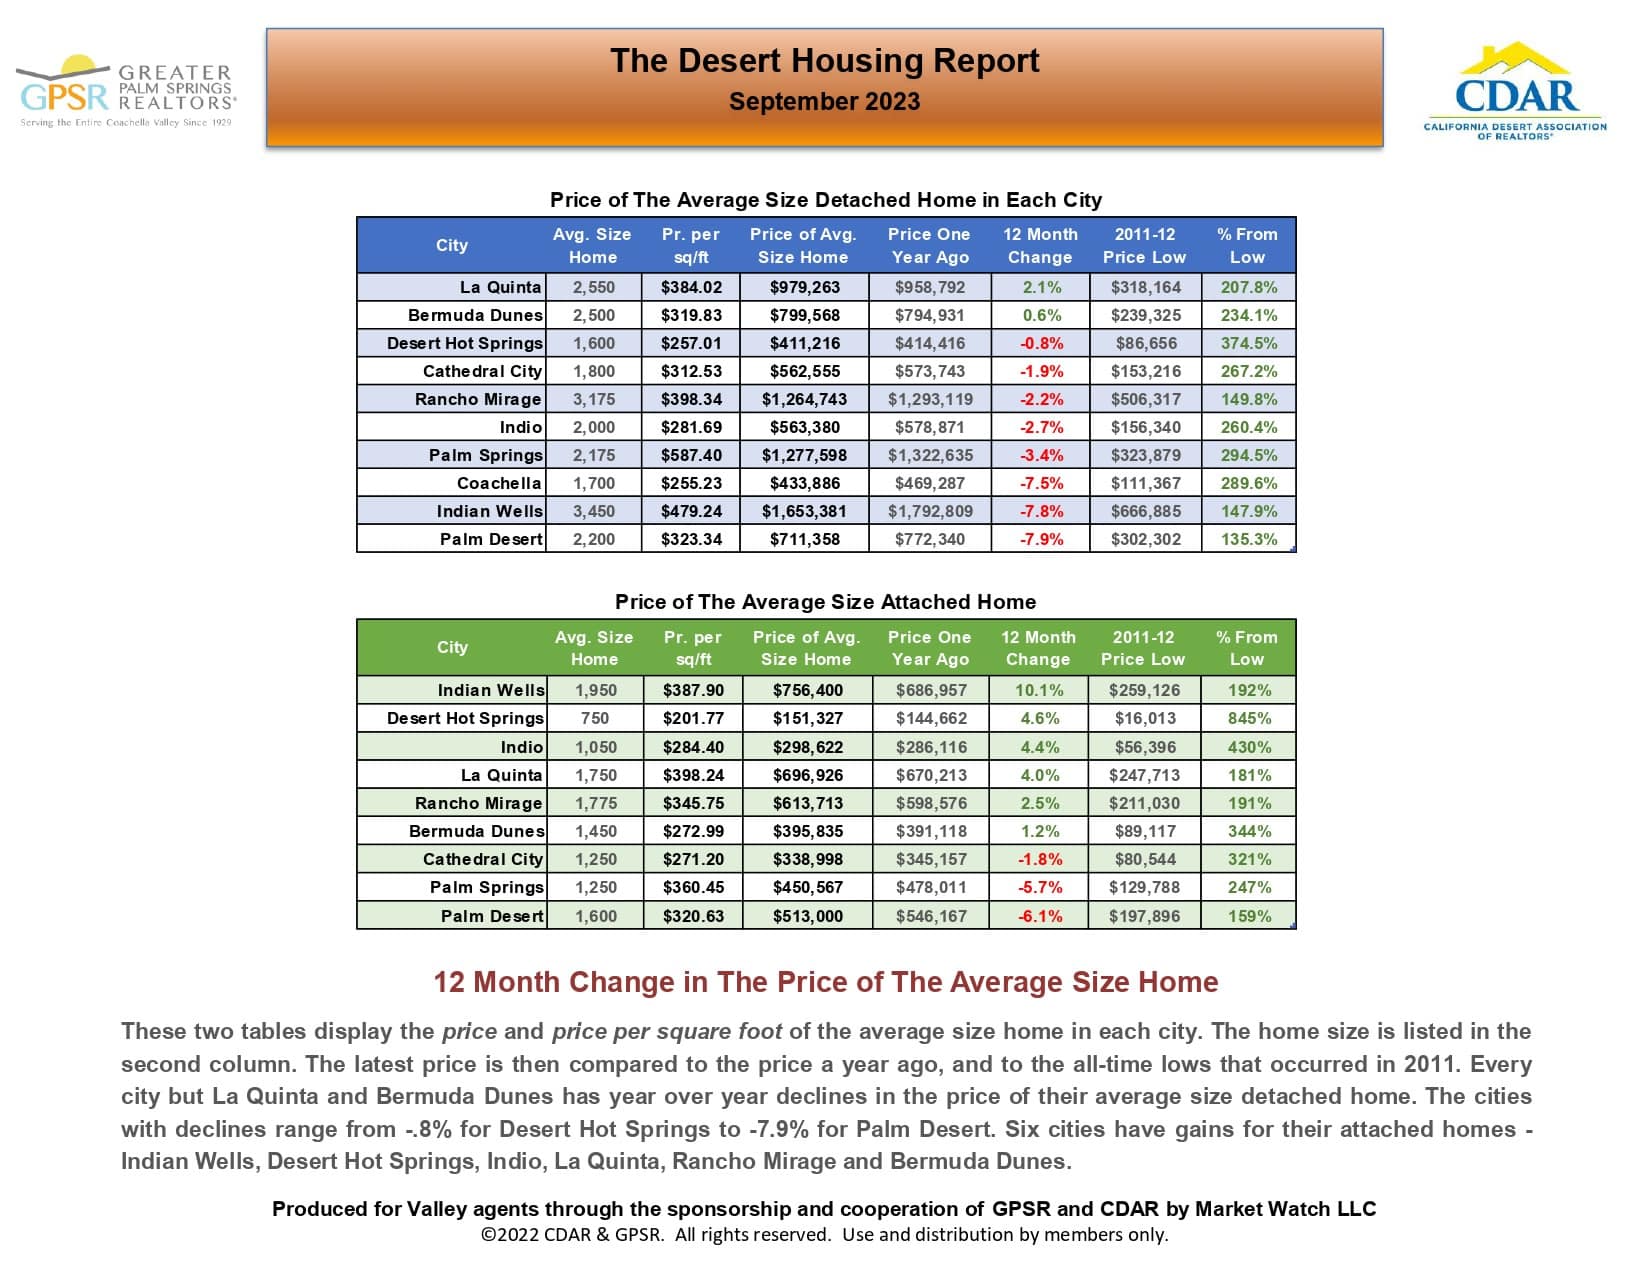
September 2023 Desert Housing Report tables compare average detached- and attached-home prices across desert cities.

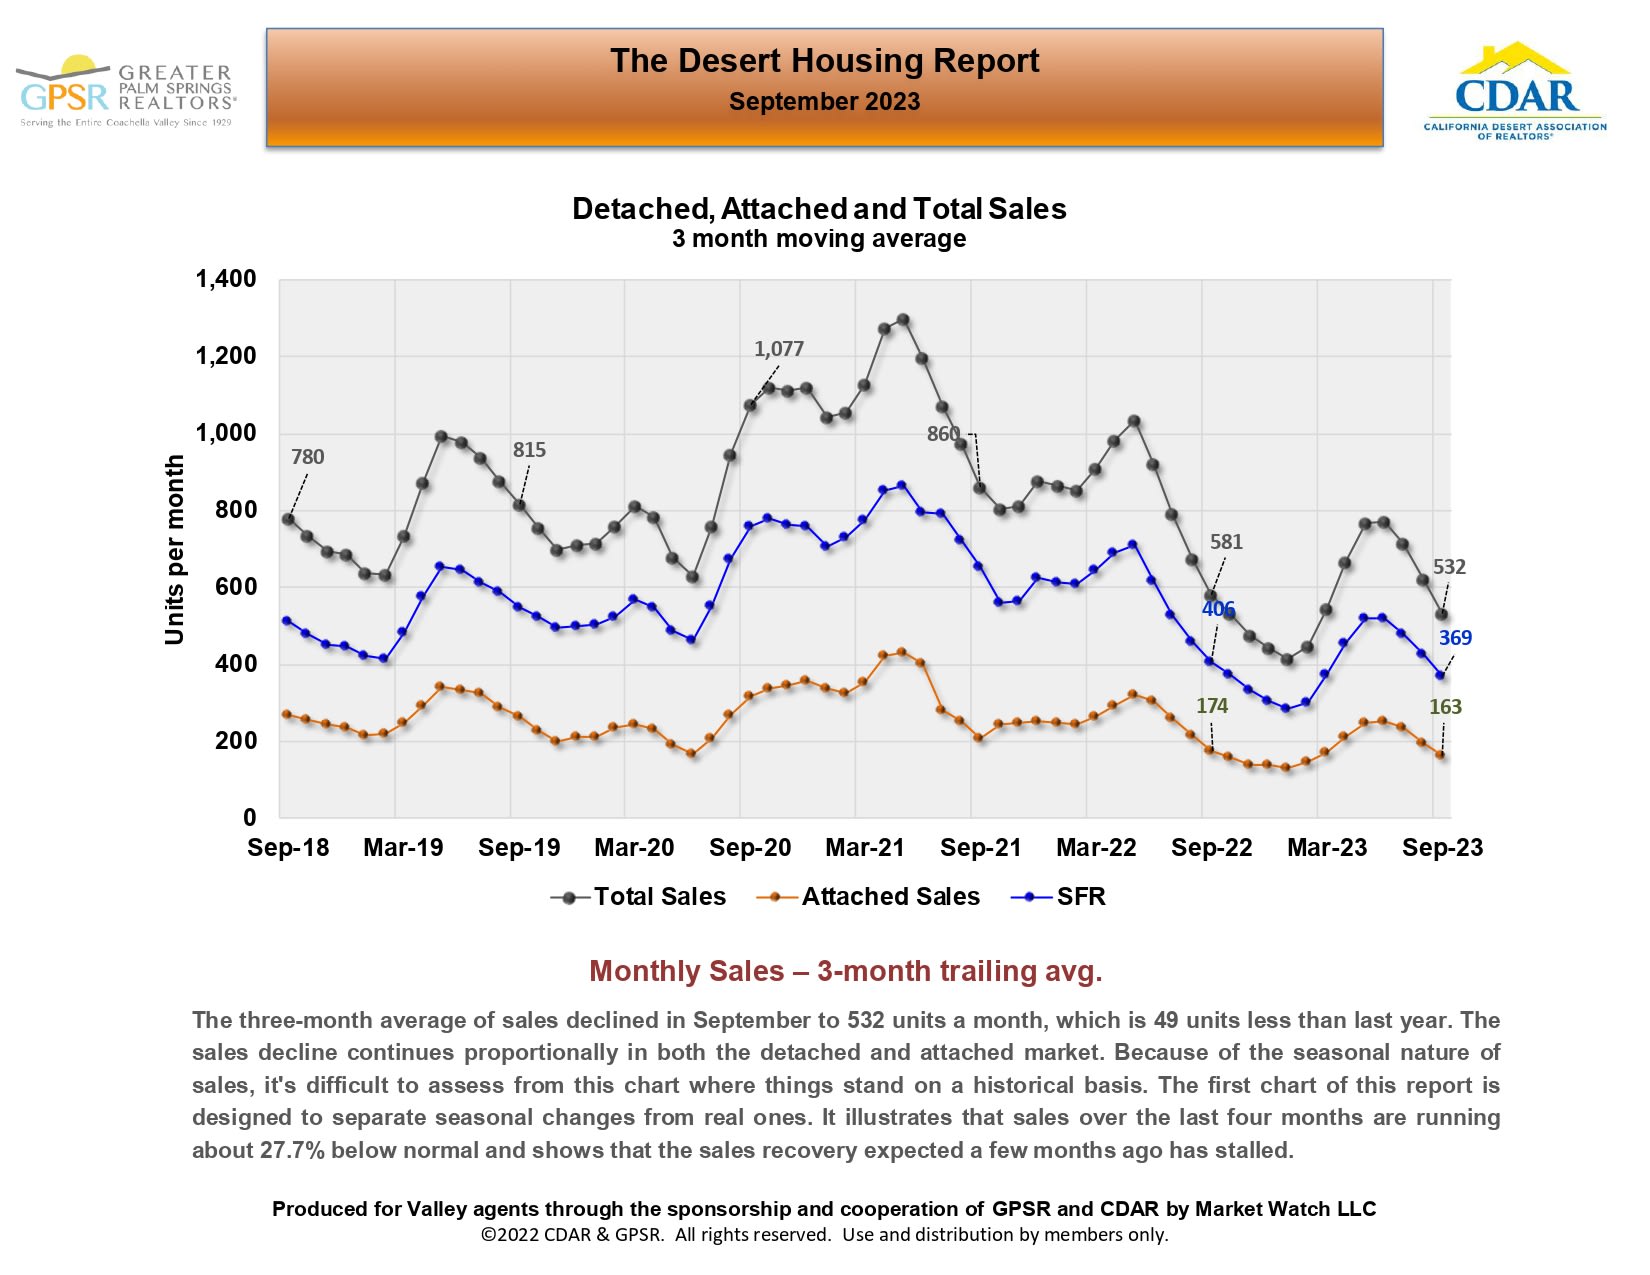
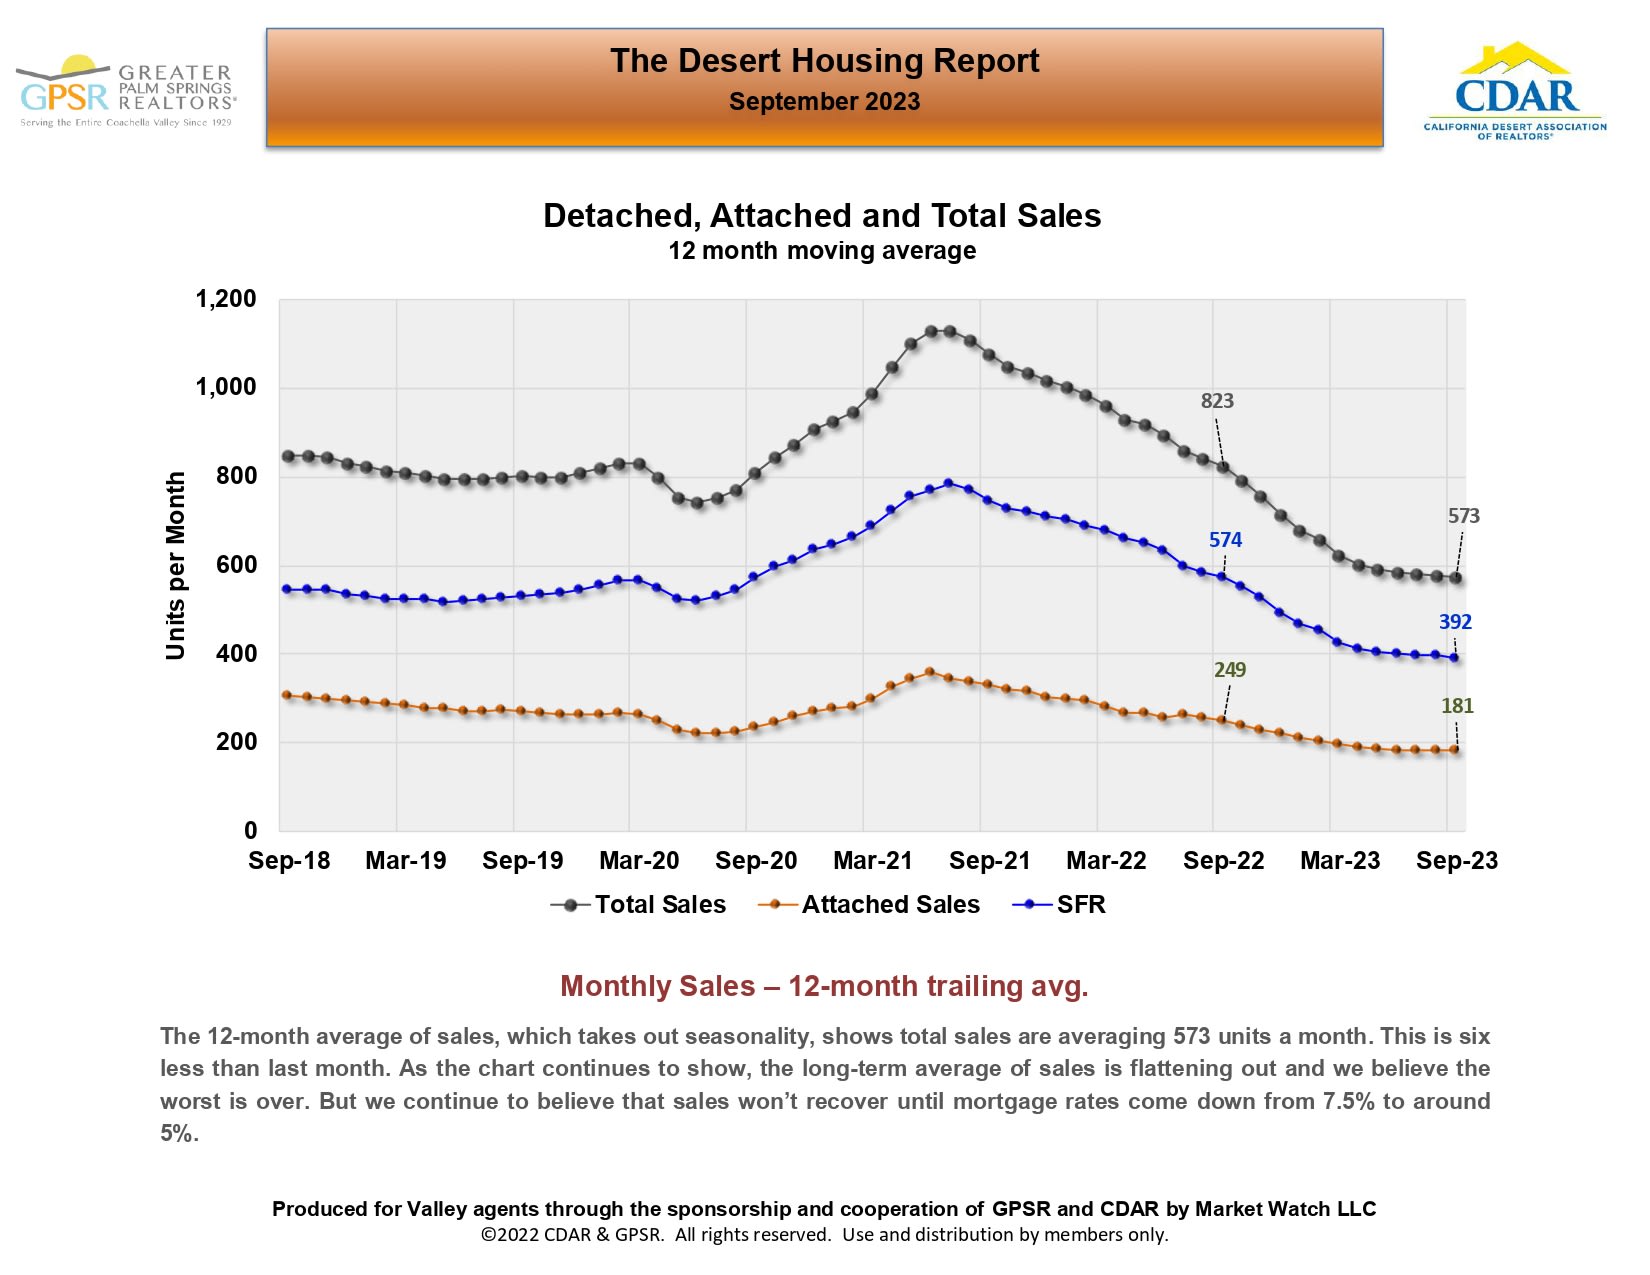
Chart of desert-area home sales from September 2018 to September 2023, with total, attached, and SFR sales lines.

September 2023 Desert Housing Report chart of monthly total, SFR, and attached home sales, with five-year trends.

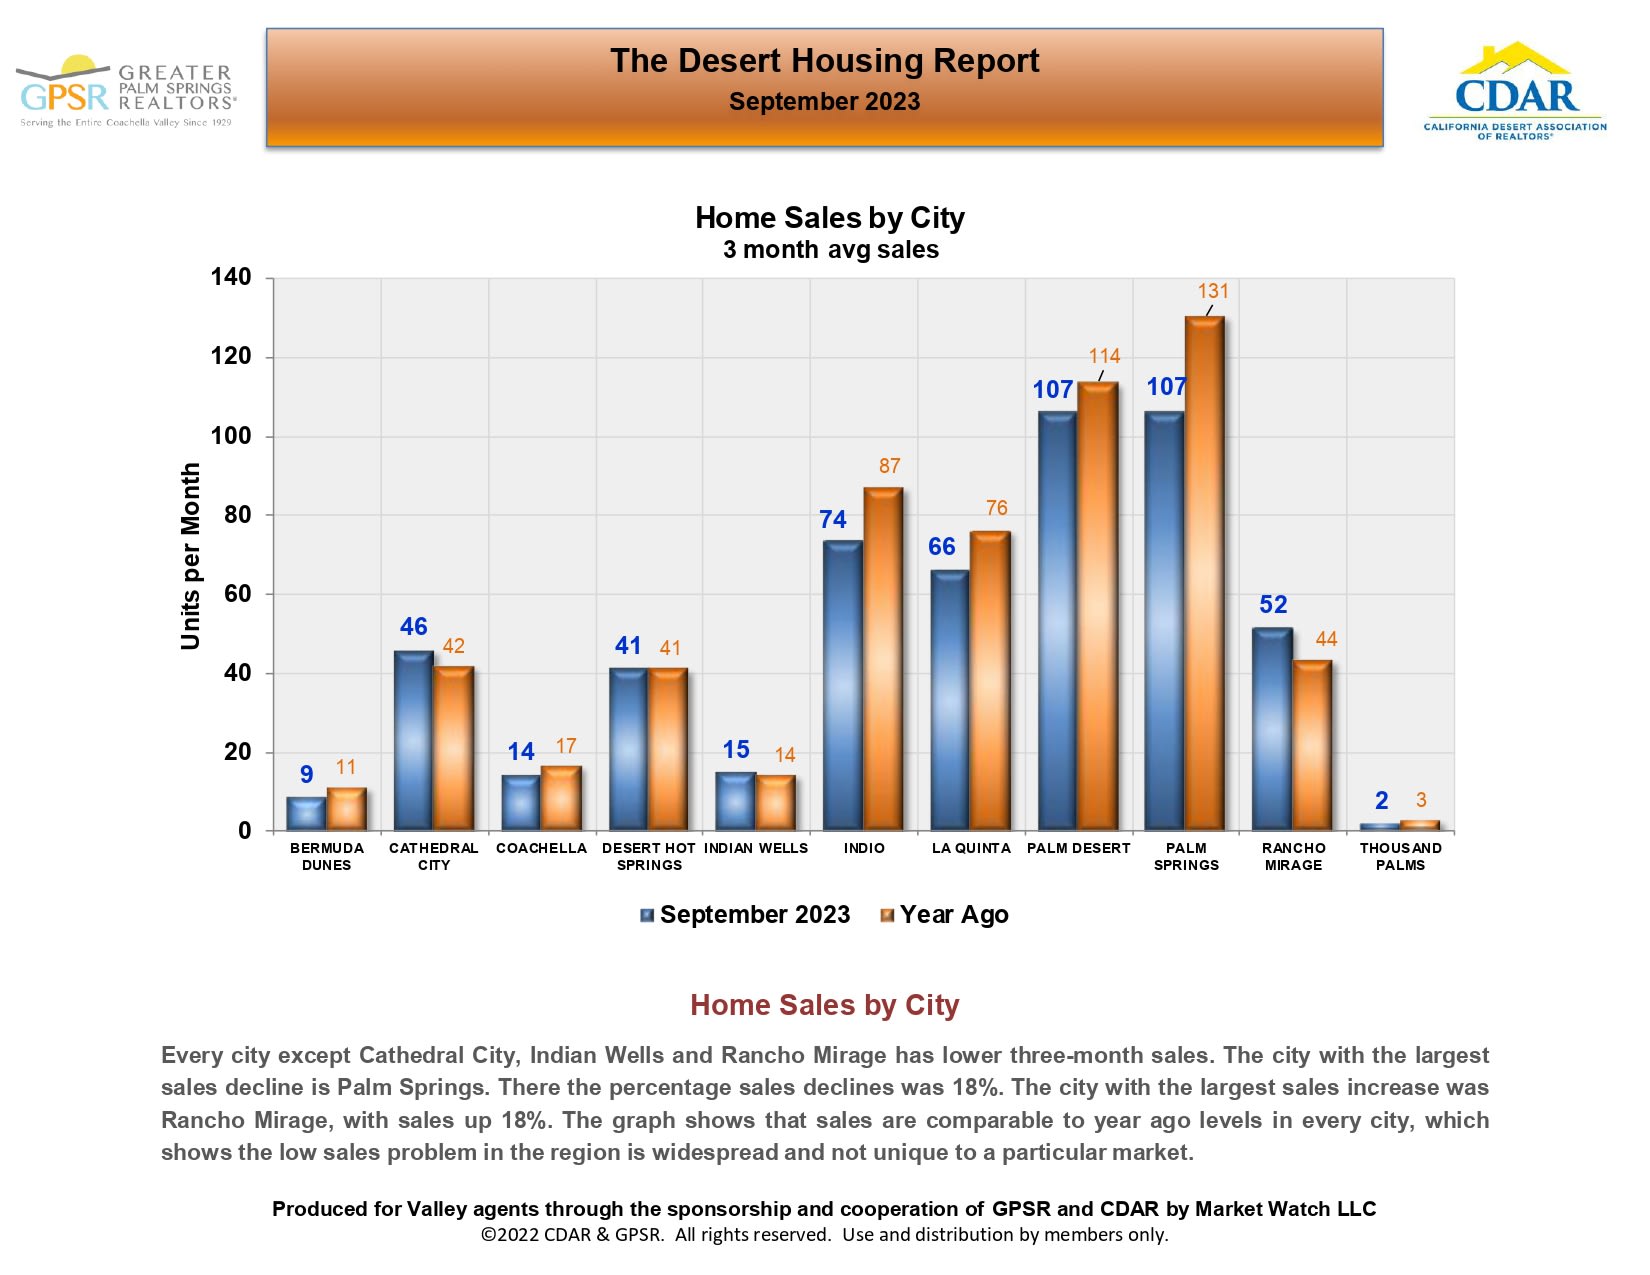
September 2023 desert home sales chart compares monthly sales across 11 cities with the year before.

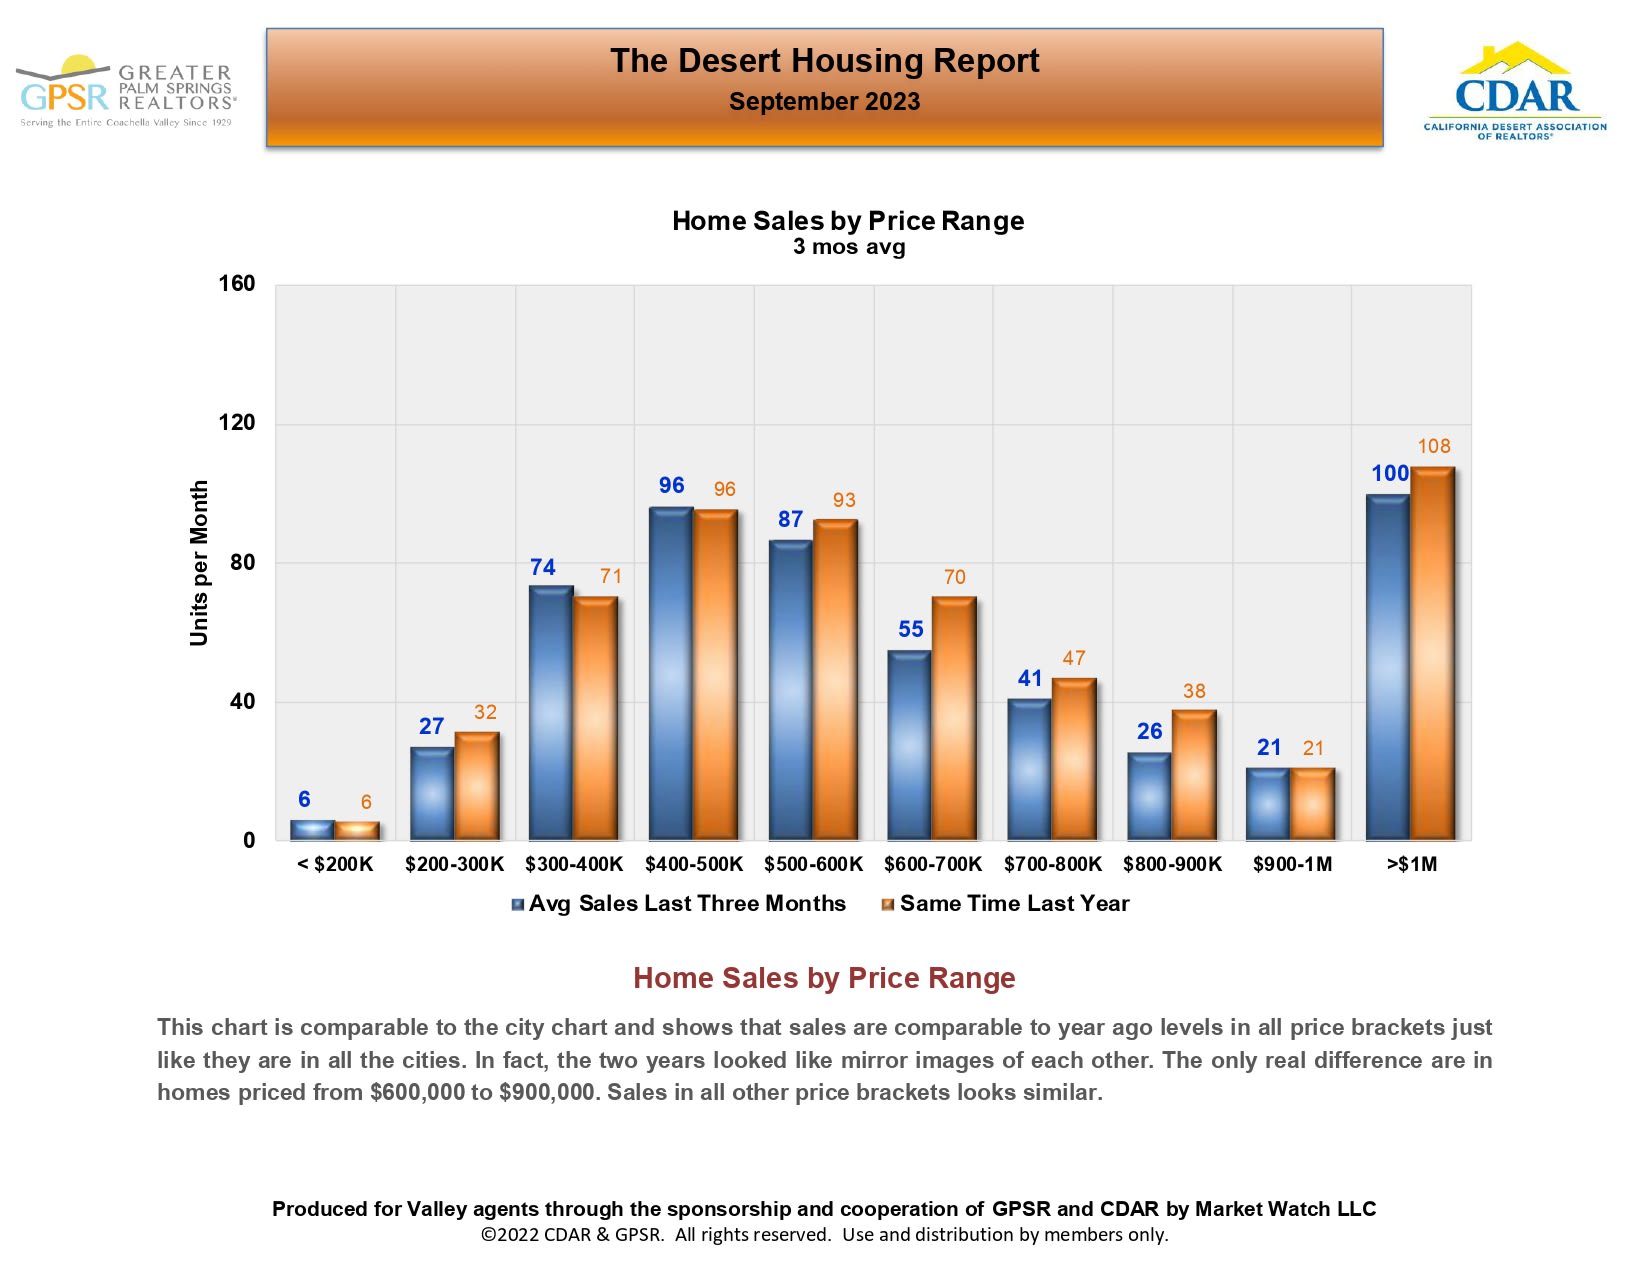
September 2023 Desert Housing Report bar chart comparing monthly home sales by price range with the same time last year.

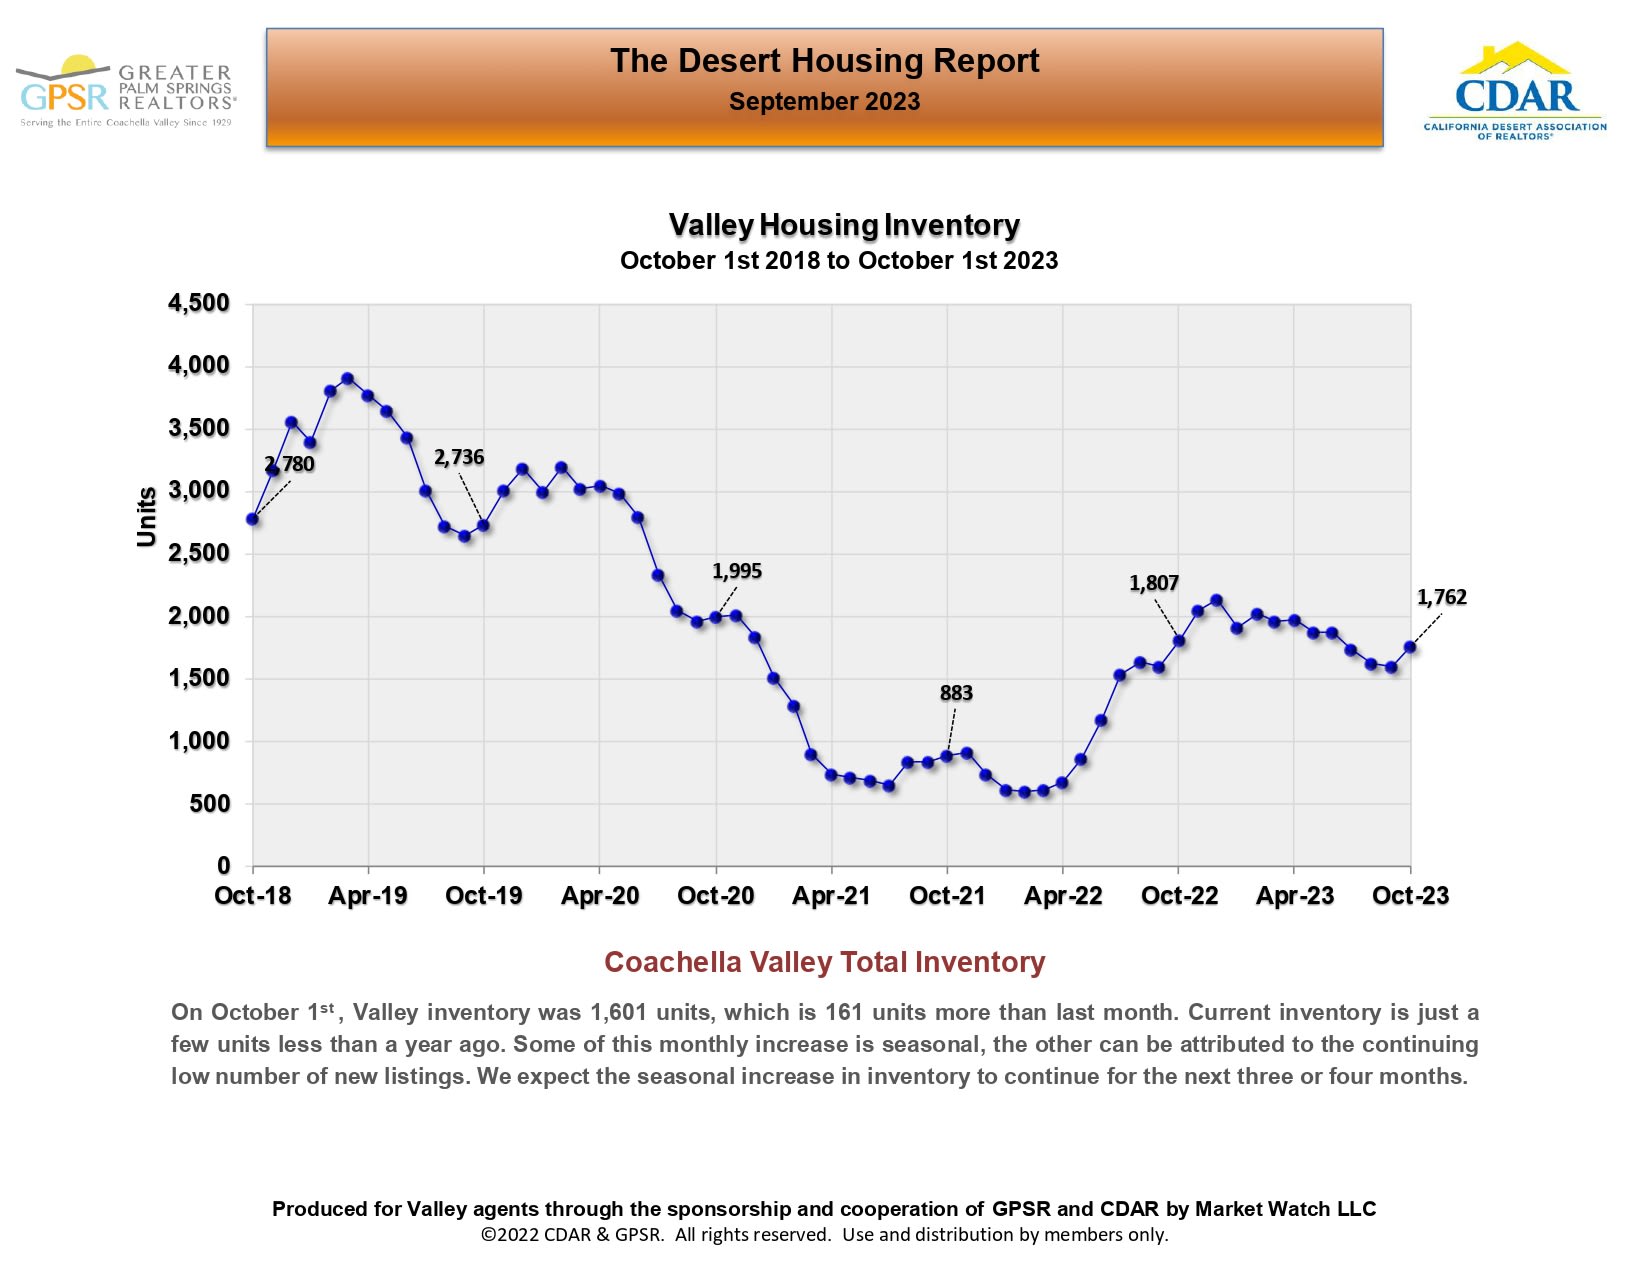
Chart tracks Coachella Valley housing inventory from 2018 to 2023, falling sharply by 2022 before recovering to 1,762 units.

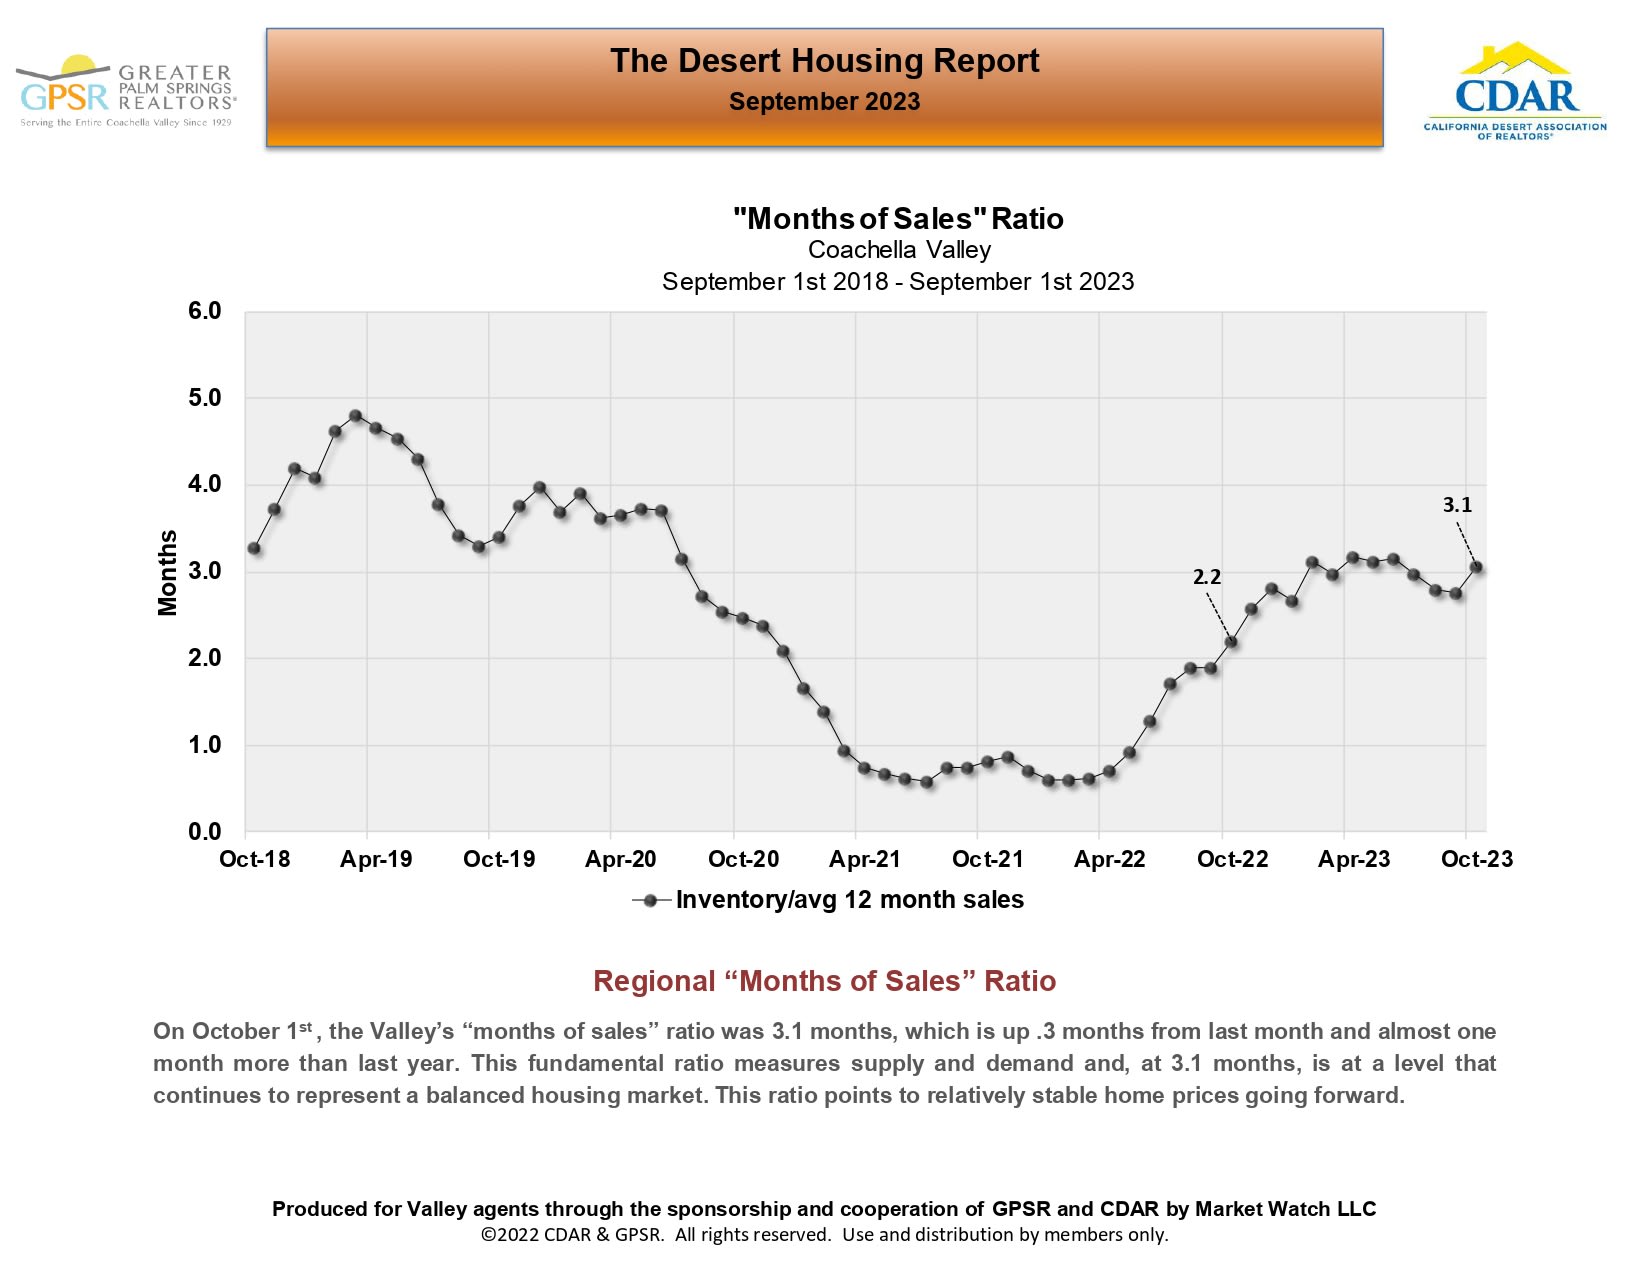
Chart of Coachella Valley months of sales, falling below one month in 2021 before rising to 3.1 in October 2023.

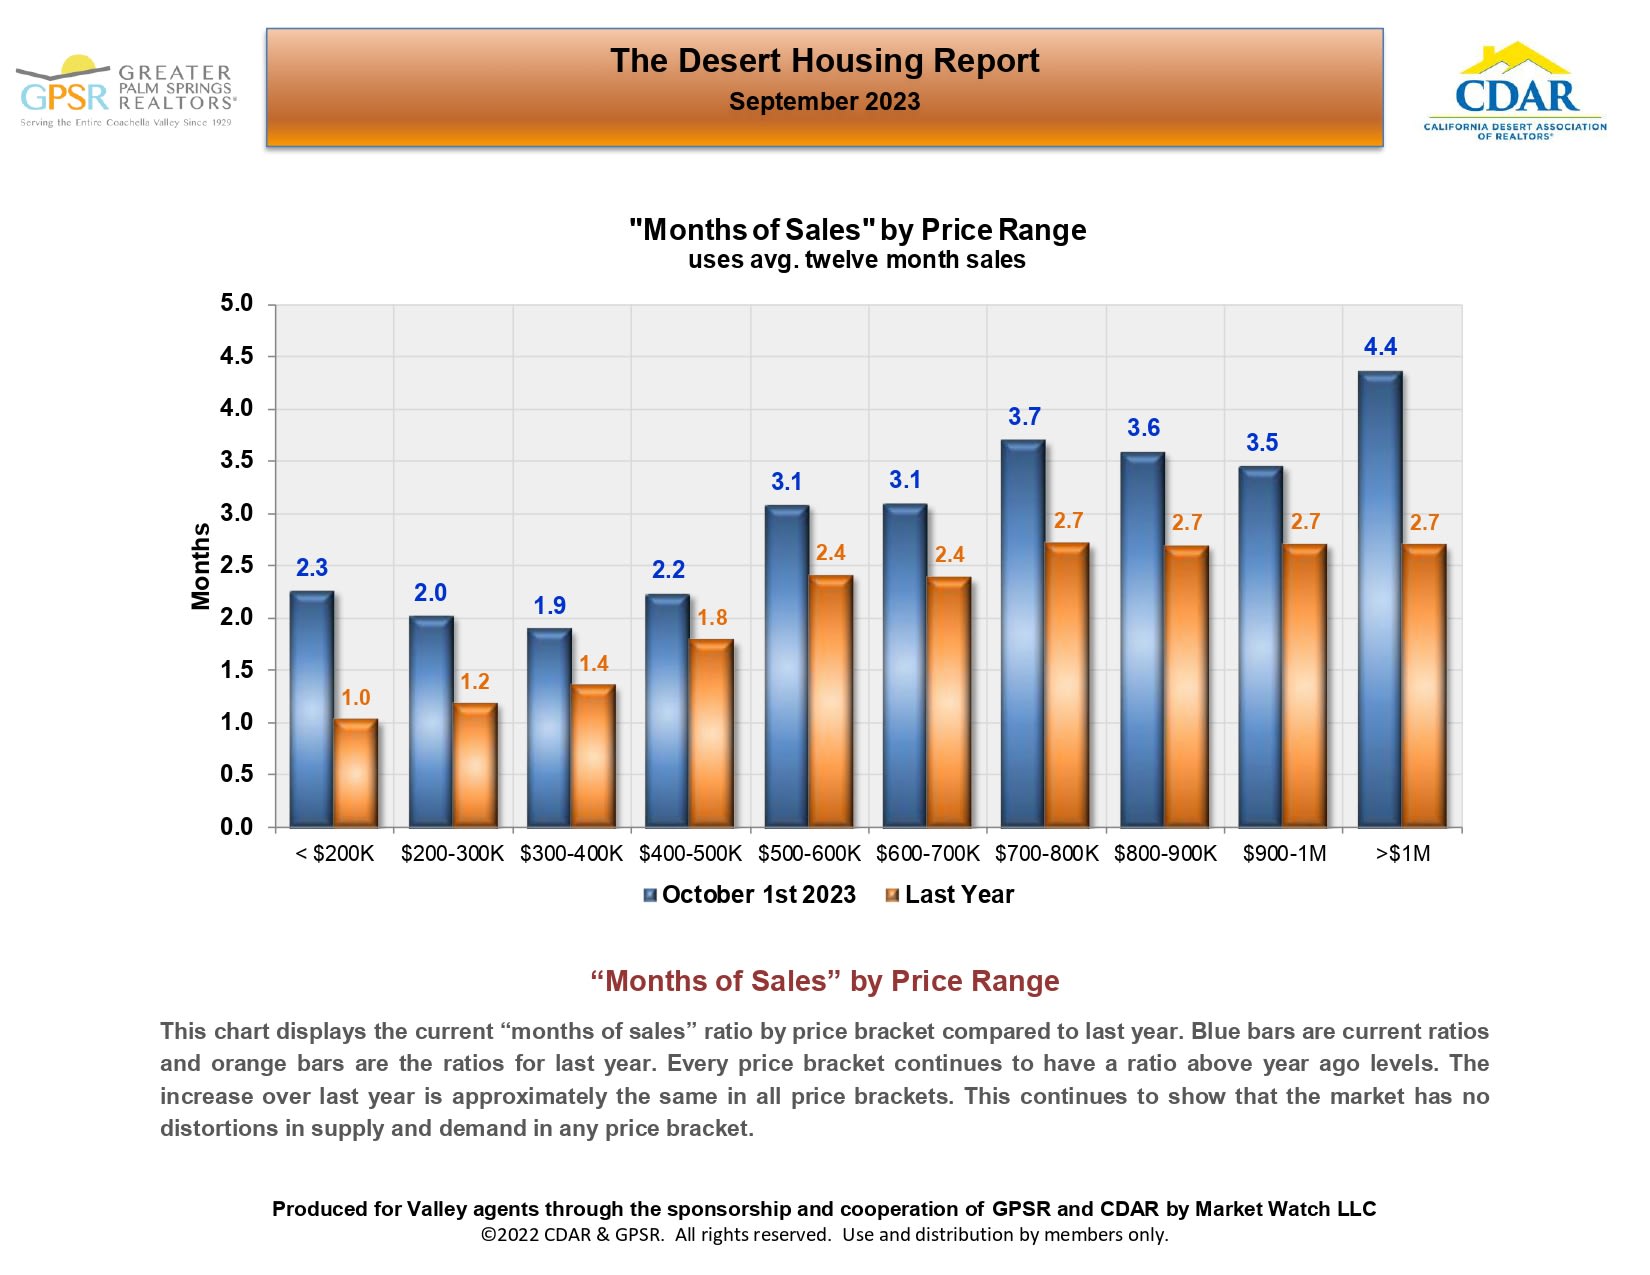
September 2023 Desert Housing Report chart comparing months of sales by price range with last year.

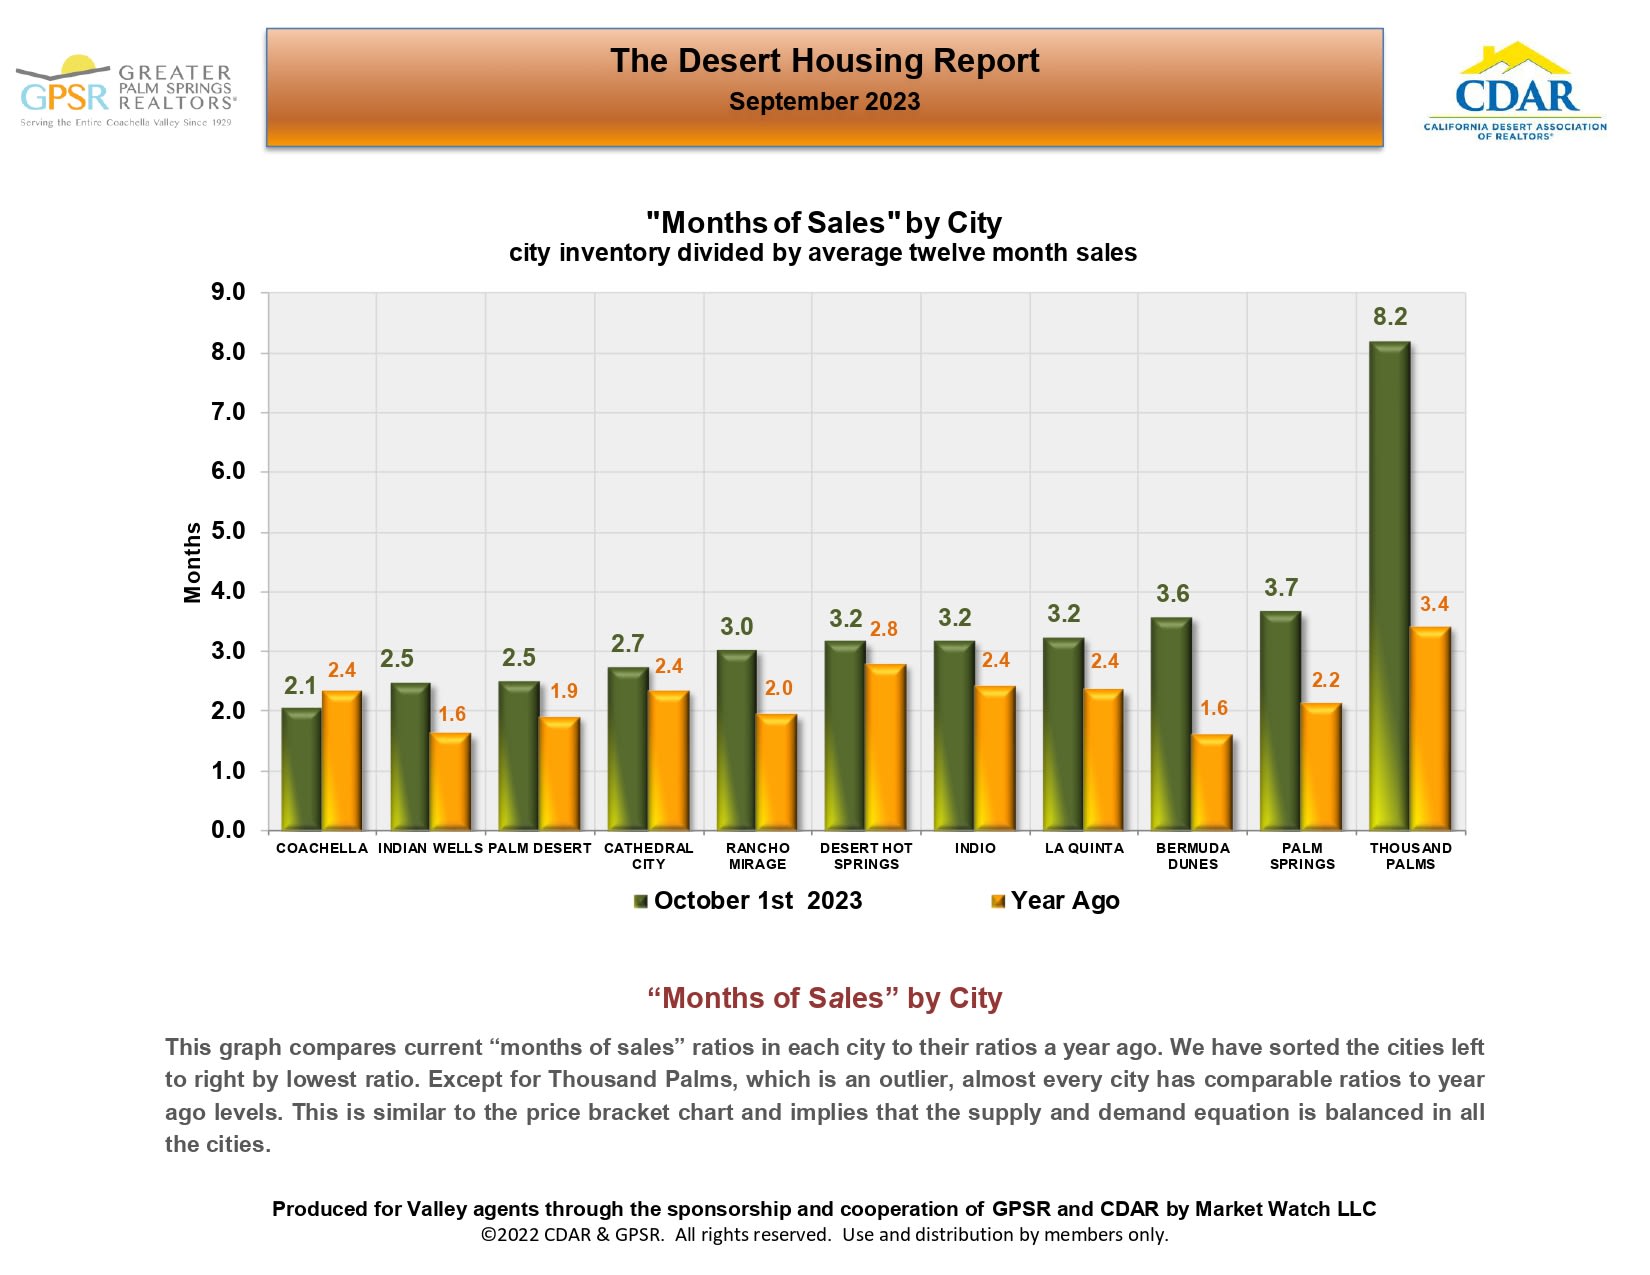
Bar chart comparing current months of sales with a year ago across Coachella Valley cities; Thousand Palms is an outlier.

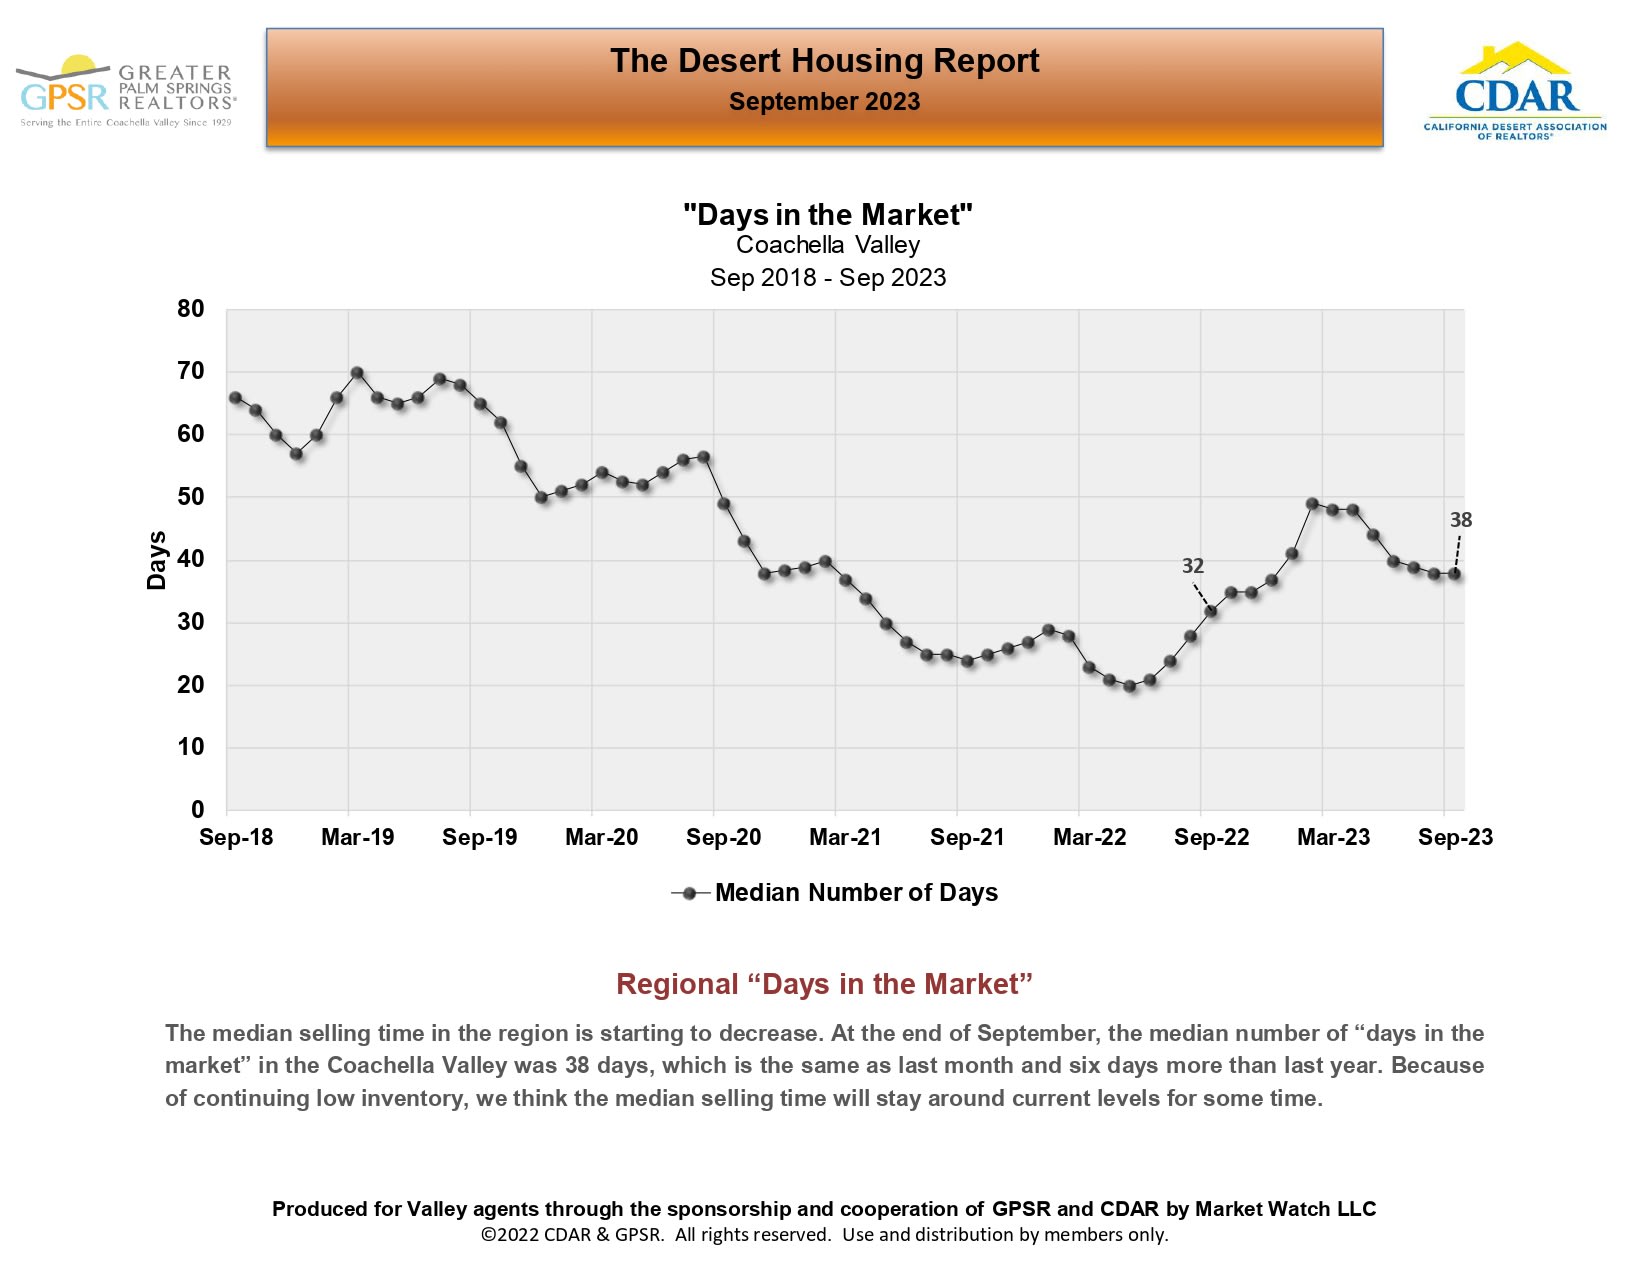
Coachella Valley median days on market chart, September 2018–September 2023, ending at 38 days.

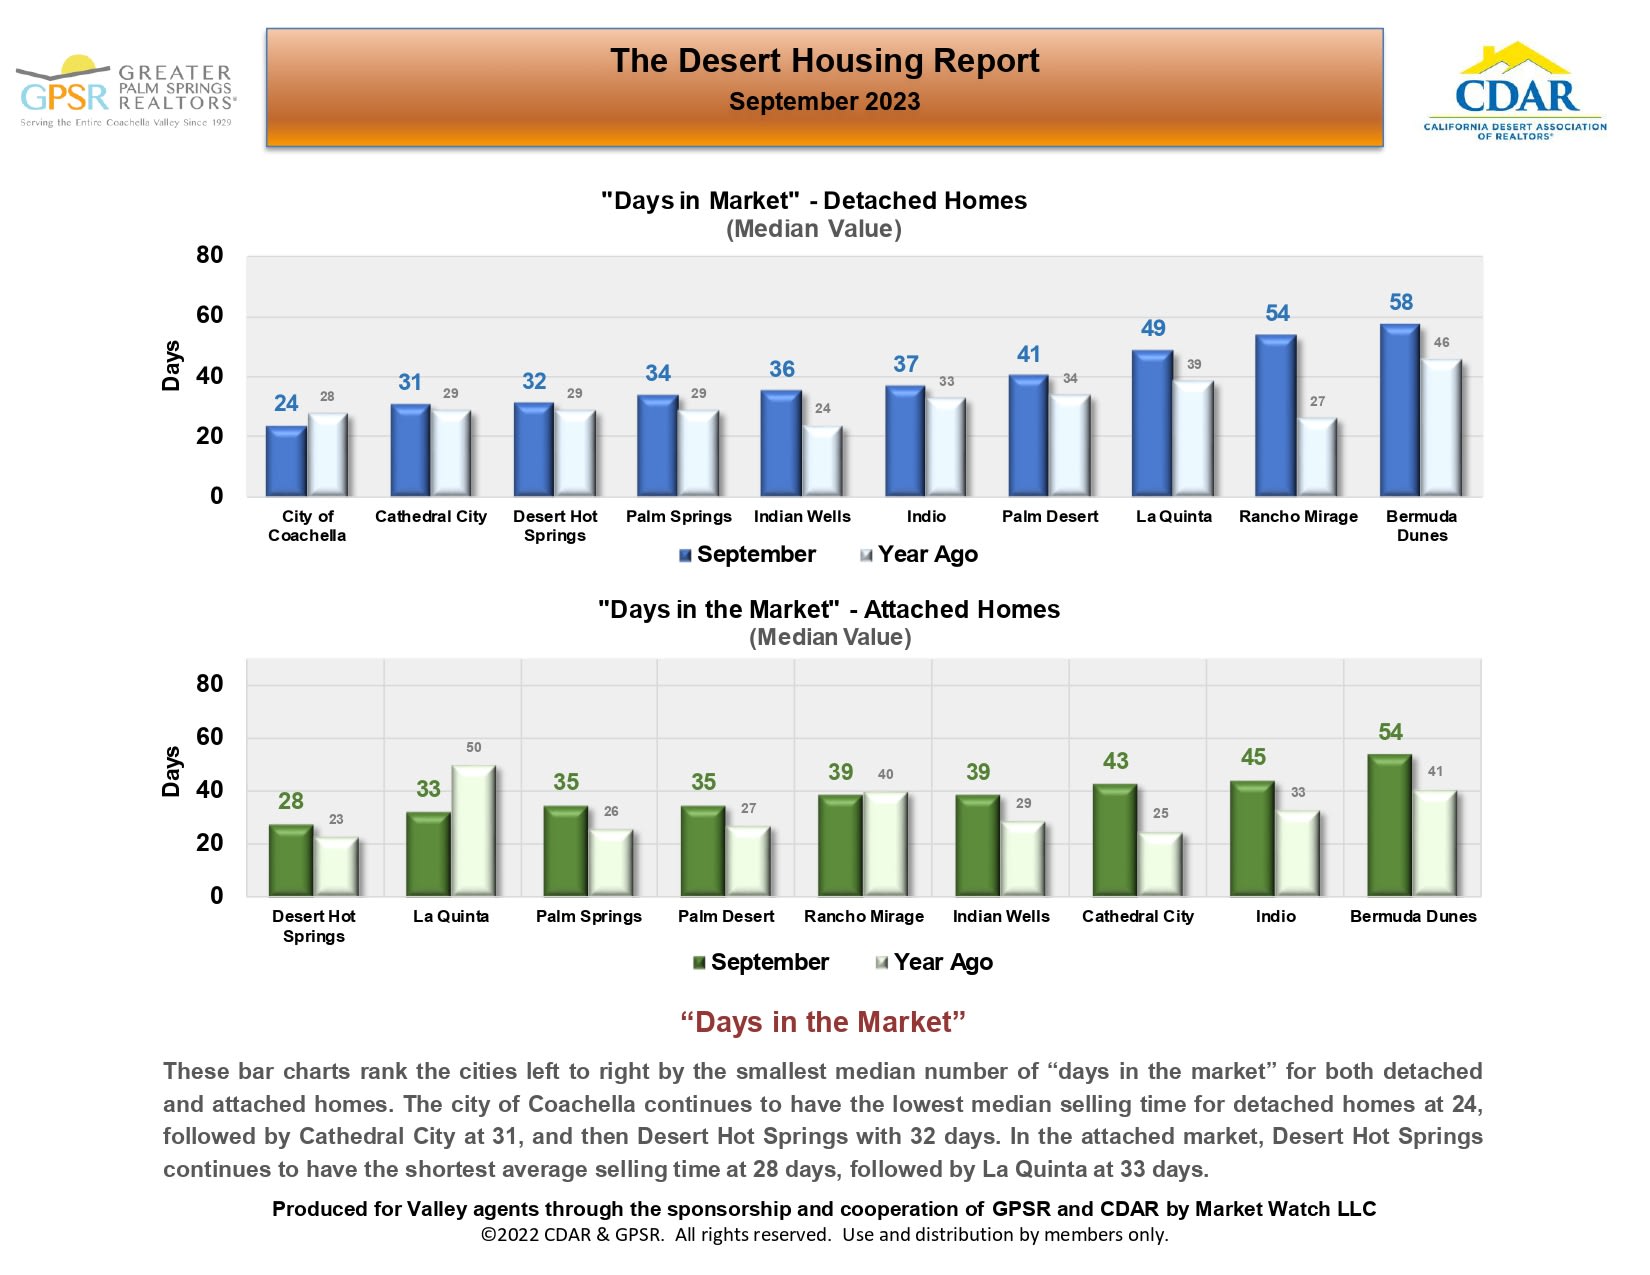
September 2023 Desert Housing Report charts comparing days on market for detached and attached homes across desert cities.

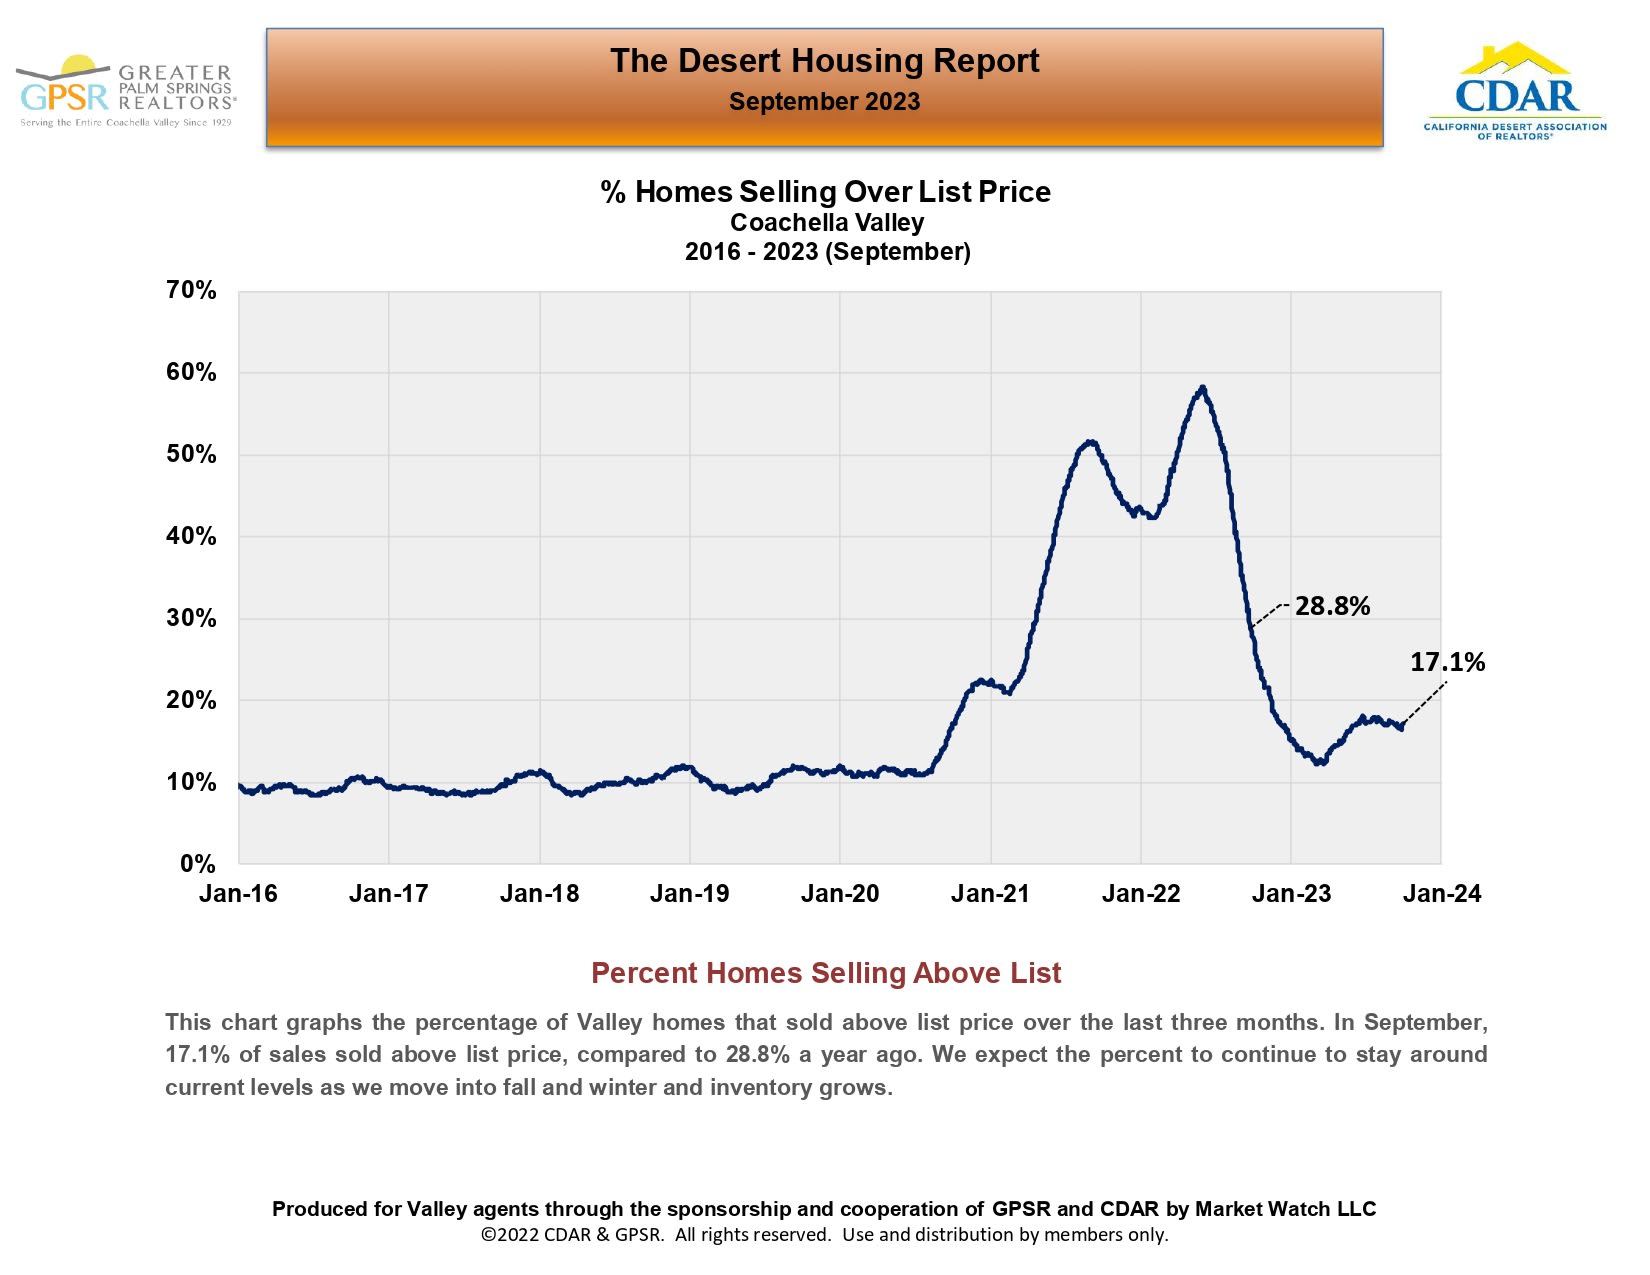
Coachella Valley homes selling above list price, charted from 2016 to September 2023; September stands at 17.1%.

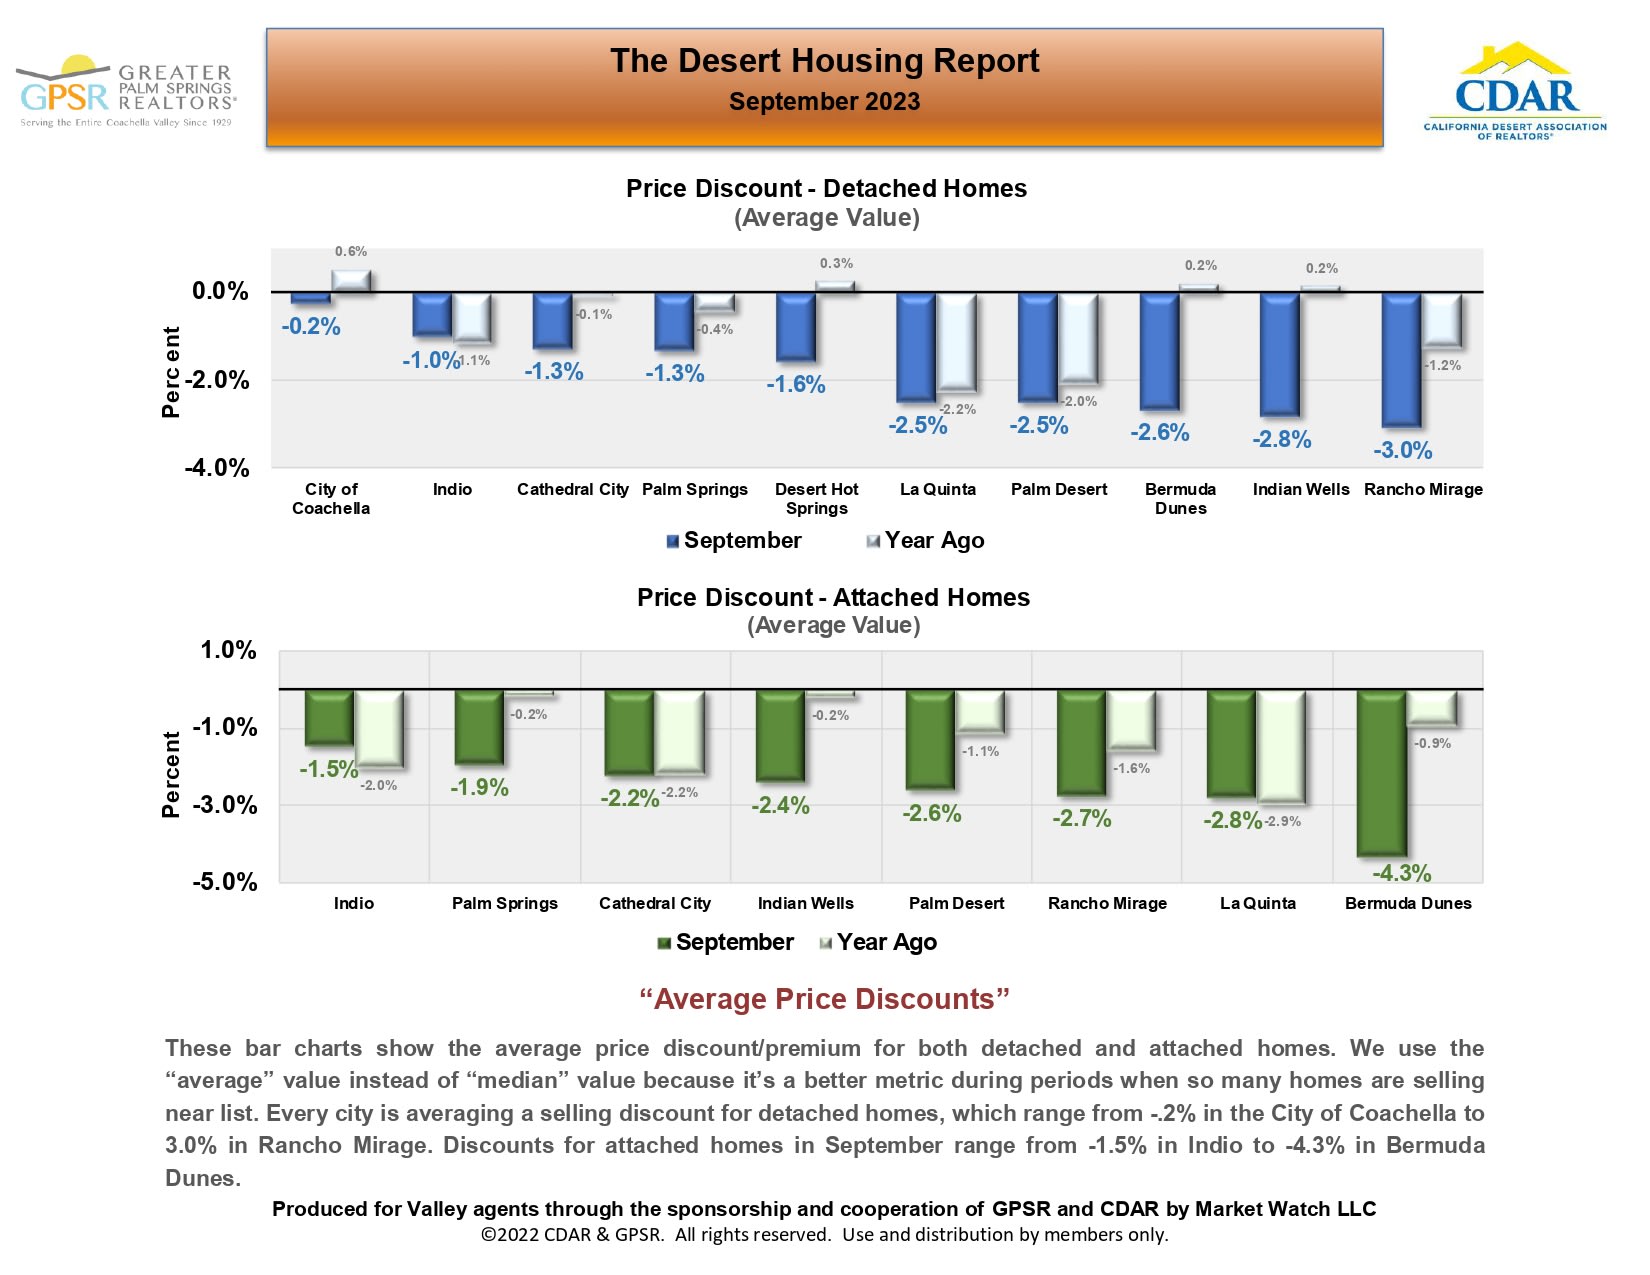
September 2023 Desert Housing Report comparing average home price discounts across desert cities.

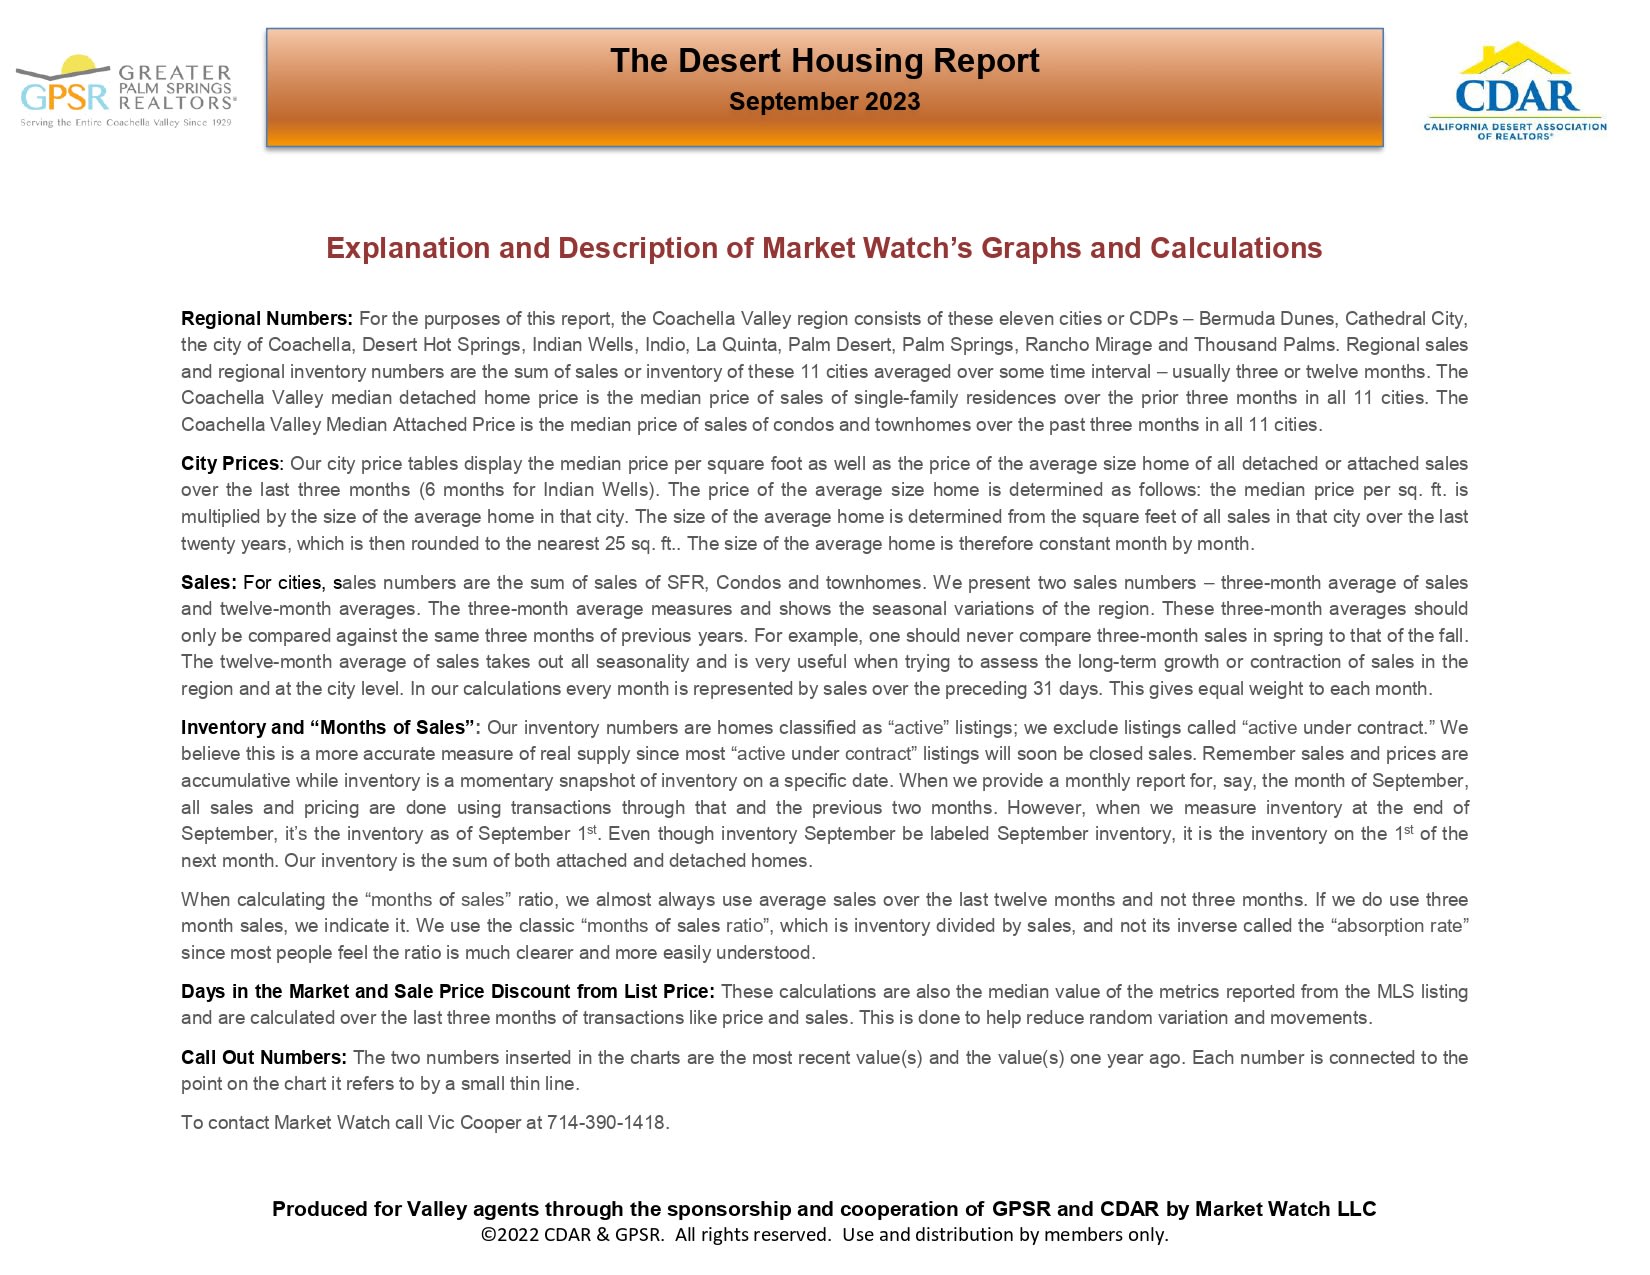
September 2023 Desert Housing Report page explaining Coachella Valley market statistics.

August 2023 Desert Housing Report cover featuring a palm-lined golf course, reflective pond, and desert mountains.

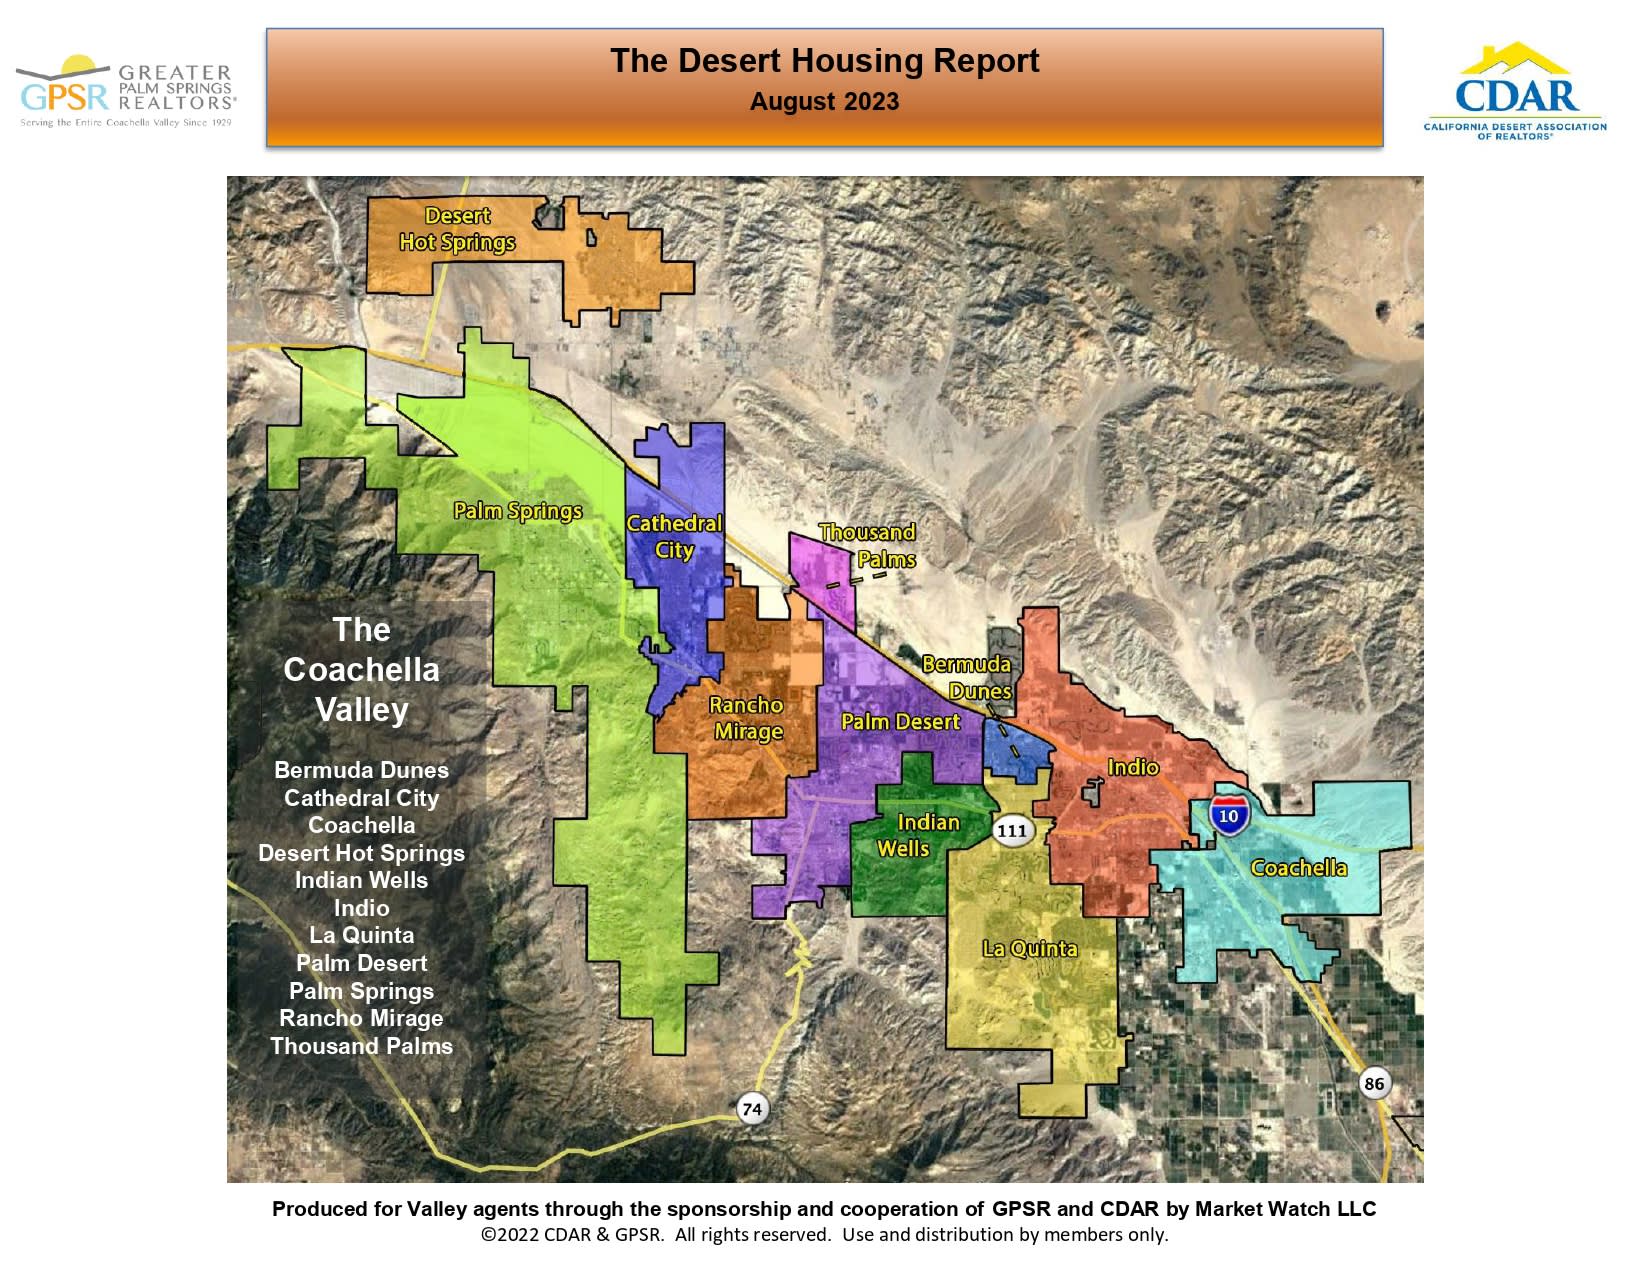
Map of Coachella Valley communities with colored boundaries, including Palm Springs, Palm Desert, Indio, and La Quinta.

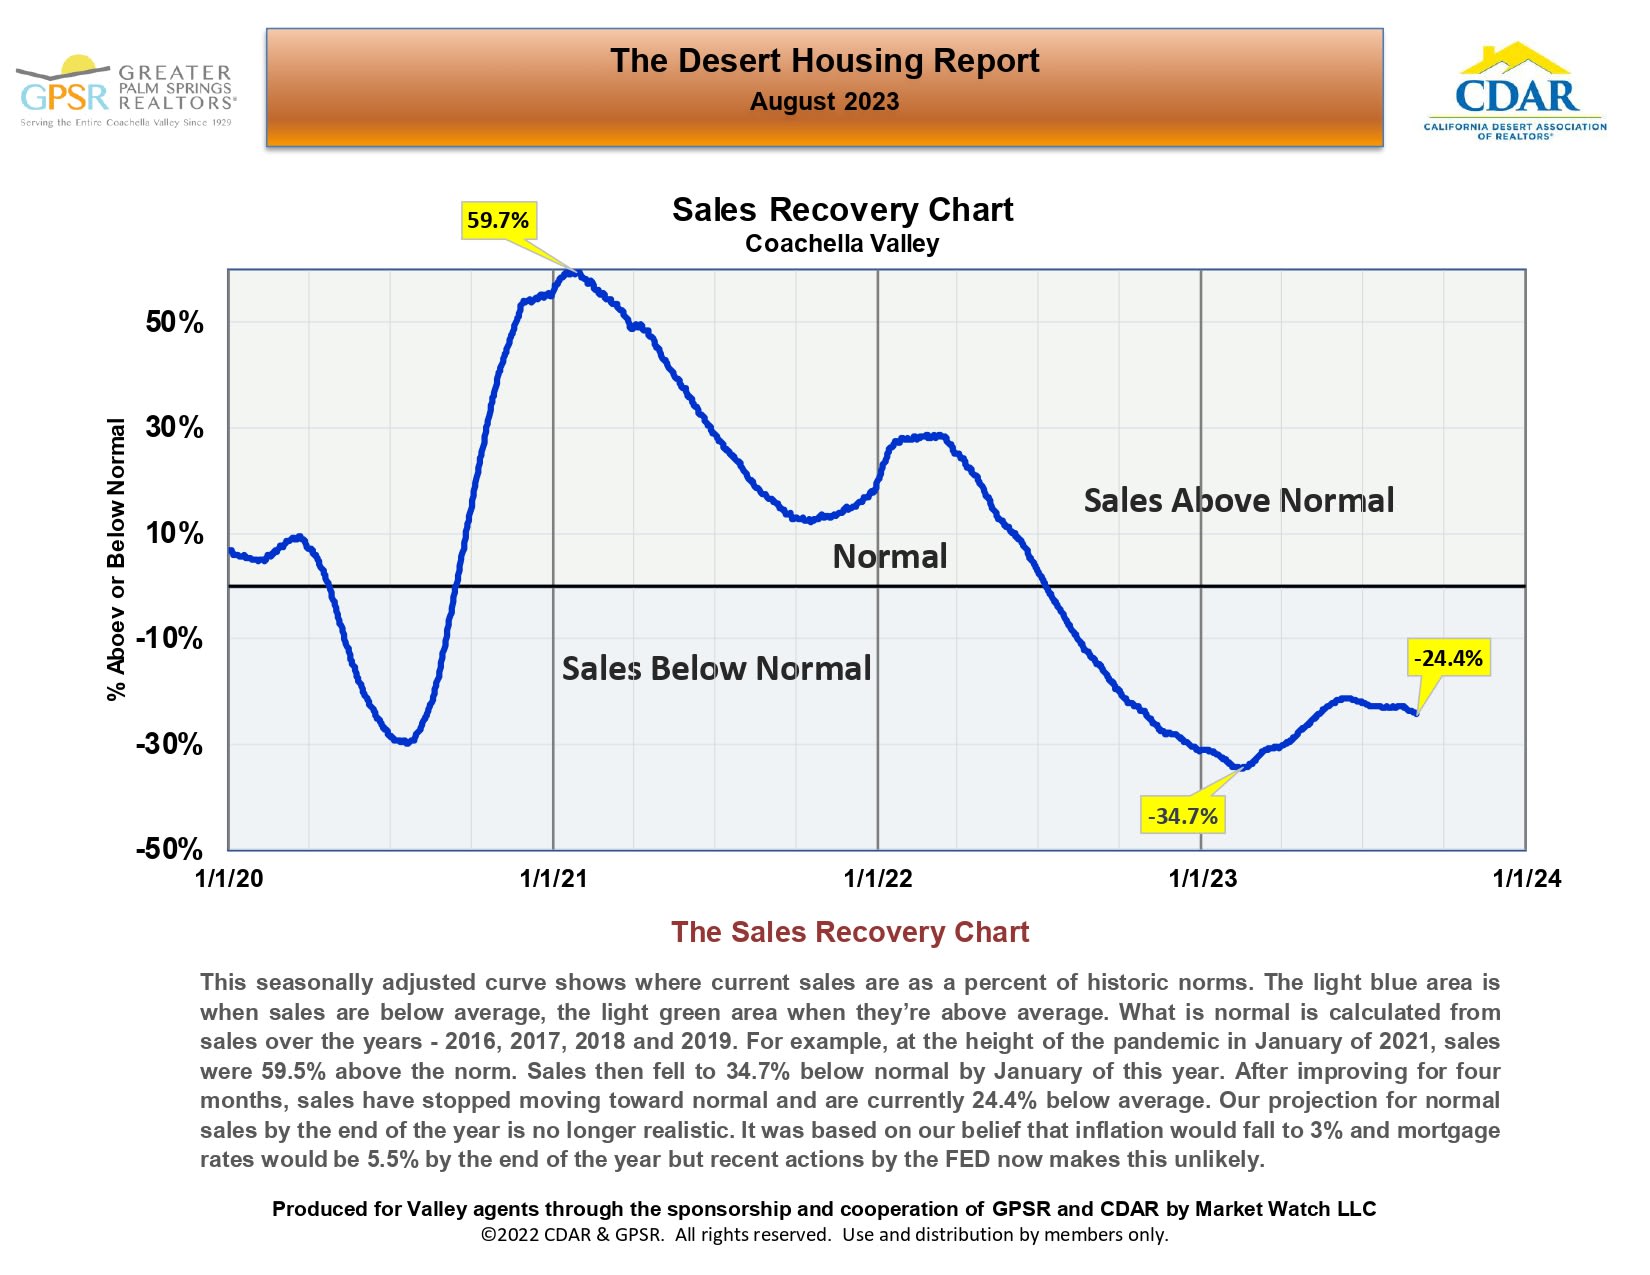
Coachella Valley sales recovery chart, showing sales 24.4% below normal in August 2023.

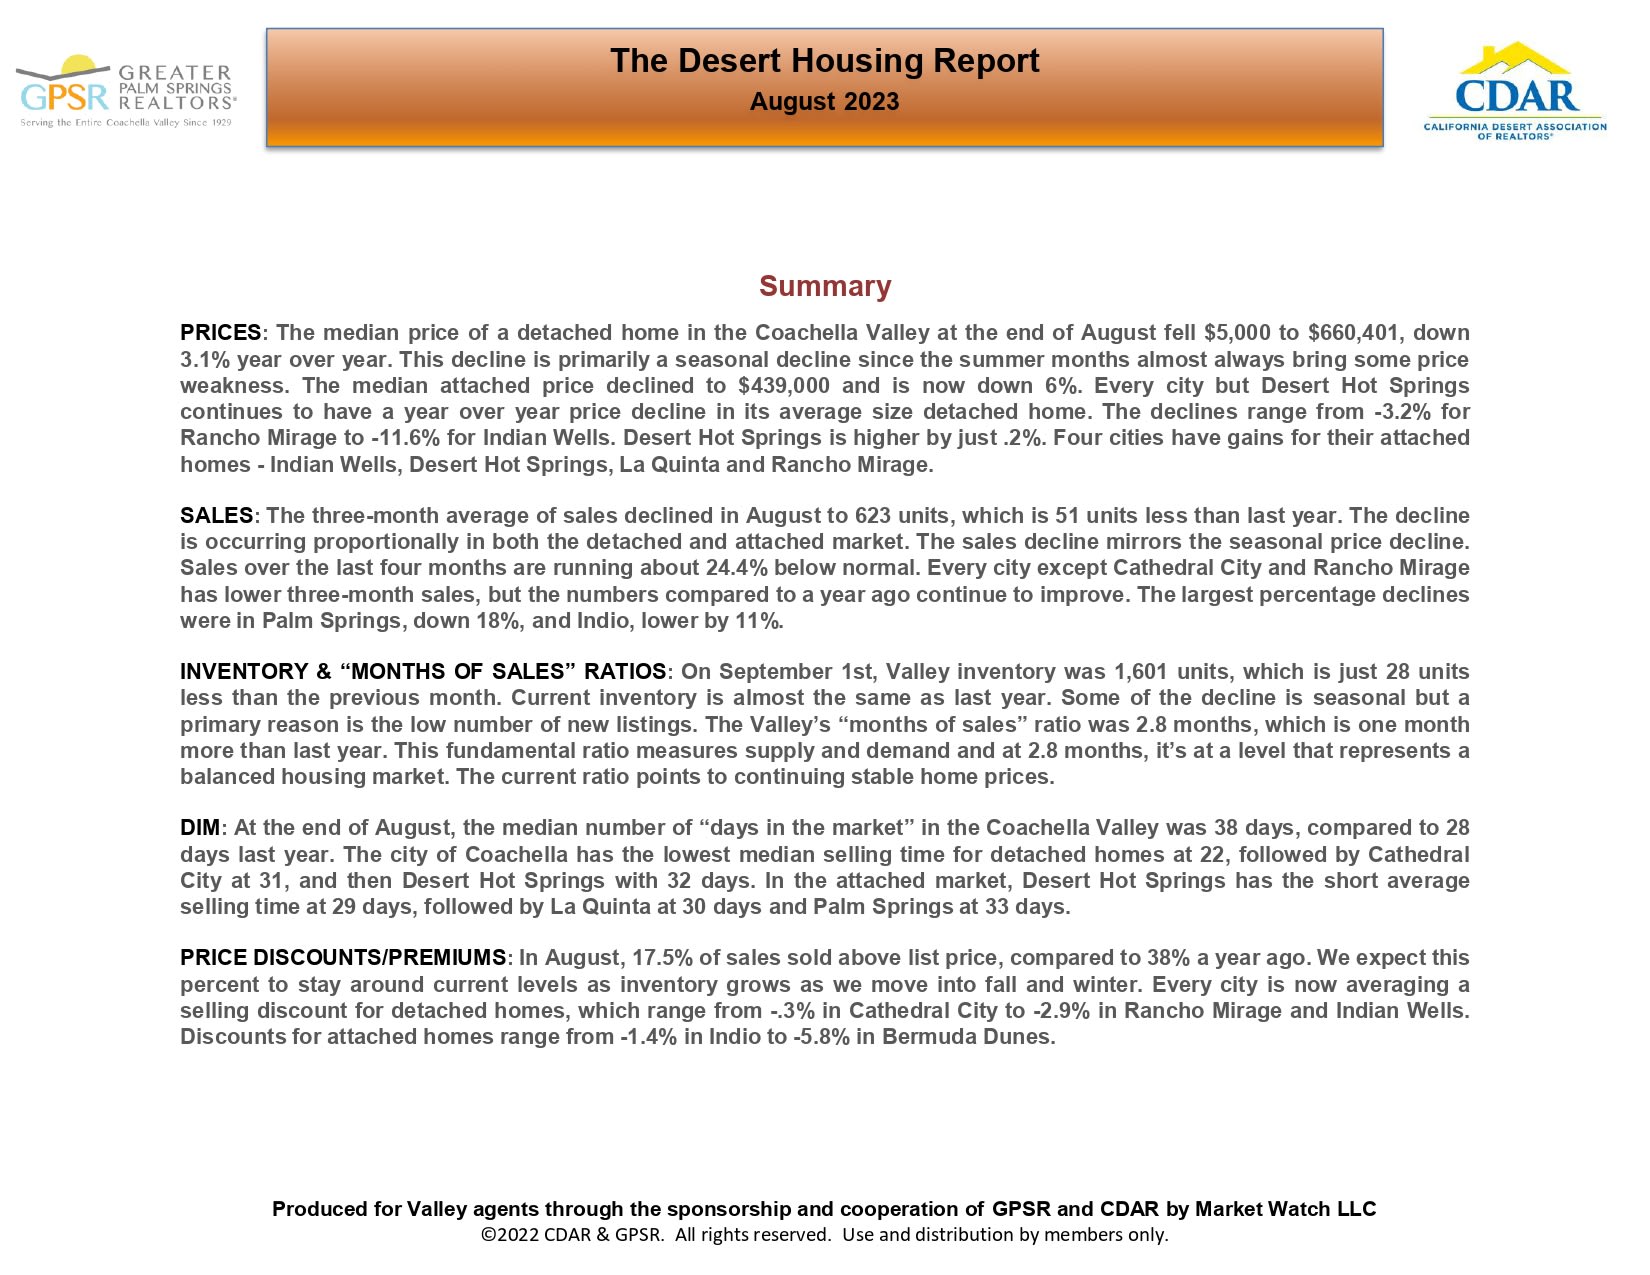
August 2023 Desert Housing Report summary for the Coachella Valley real estate market.

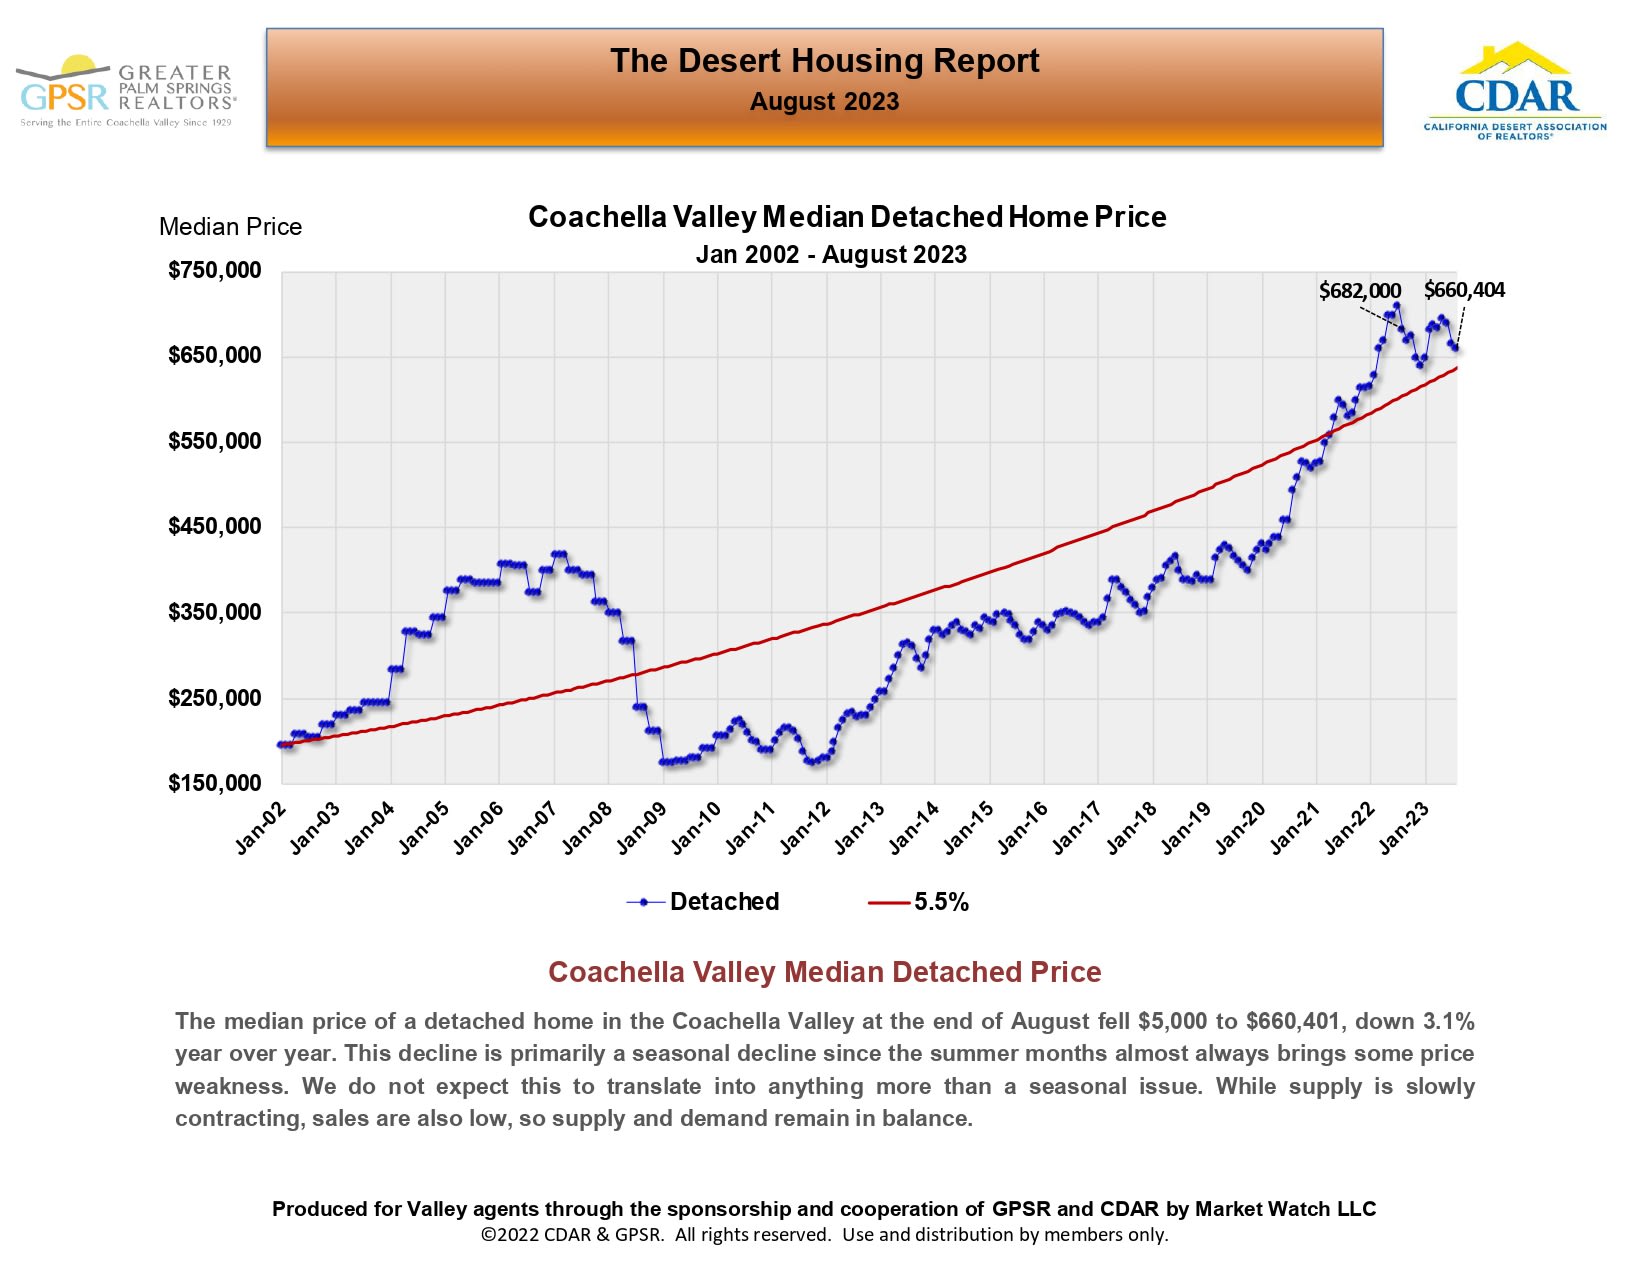
Chart of Coachella Valley median detached-home prices from 2002 to August 2023, ending at $660,404.

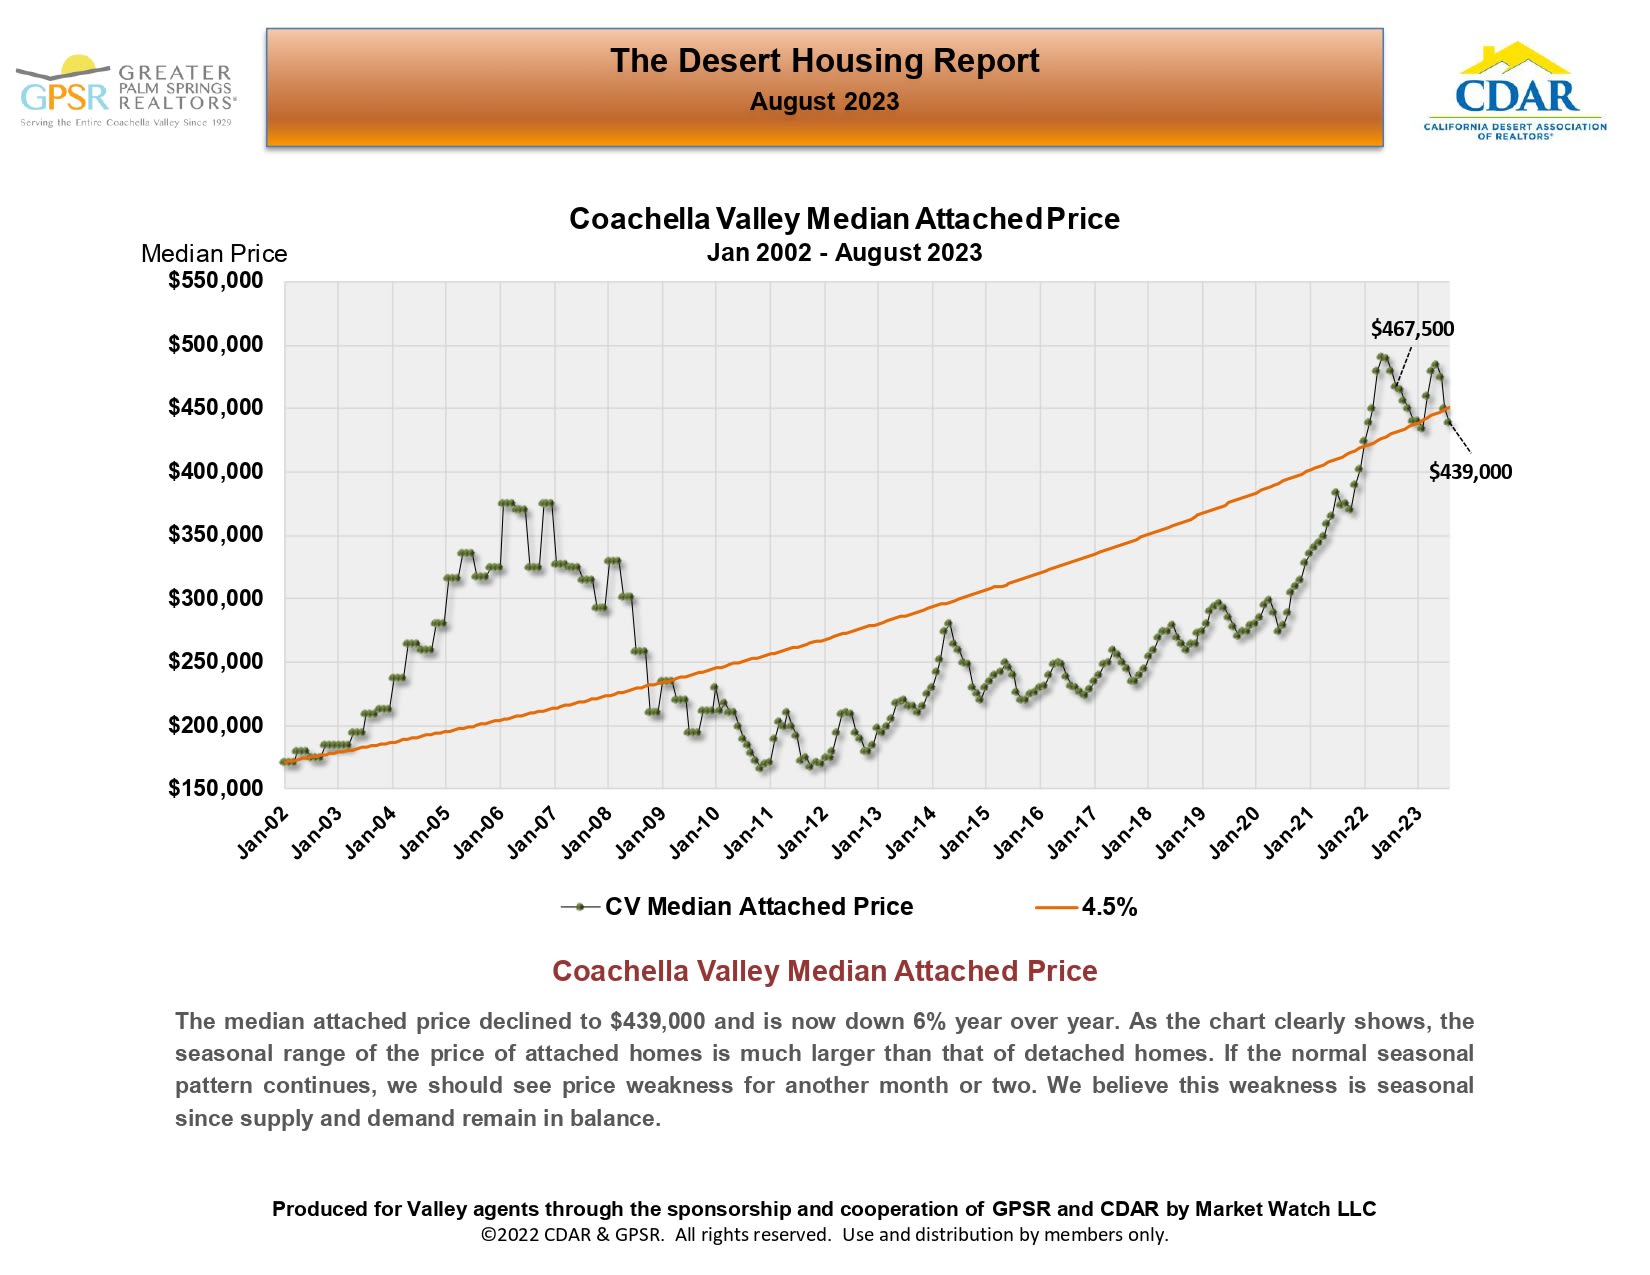
Chart of Coachella Valley median attached prices, January 2002–August 2023, ending at $439,000.

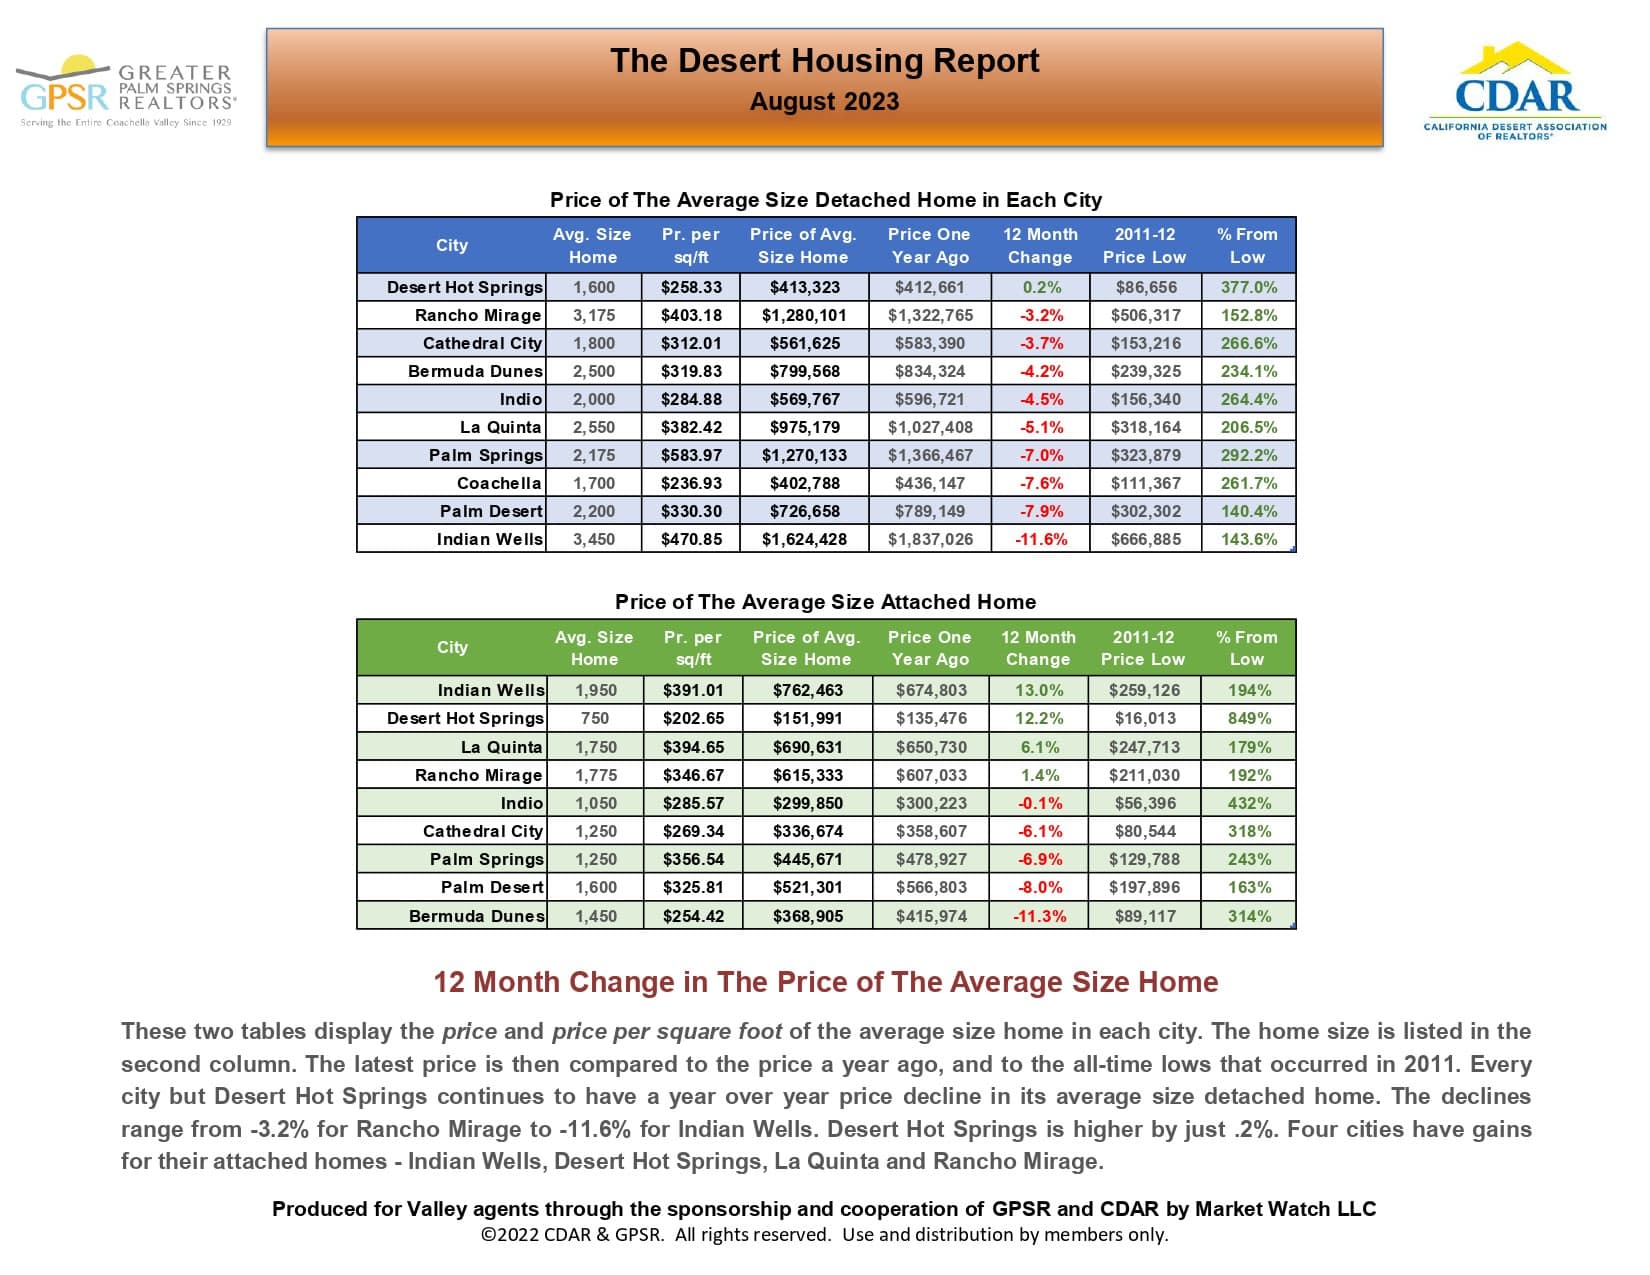
August 2023 Desert Housing Report compares detached and attached home prices across Coachella Valley cities.

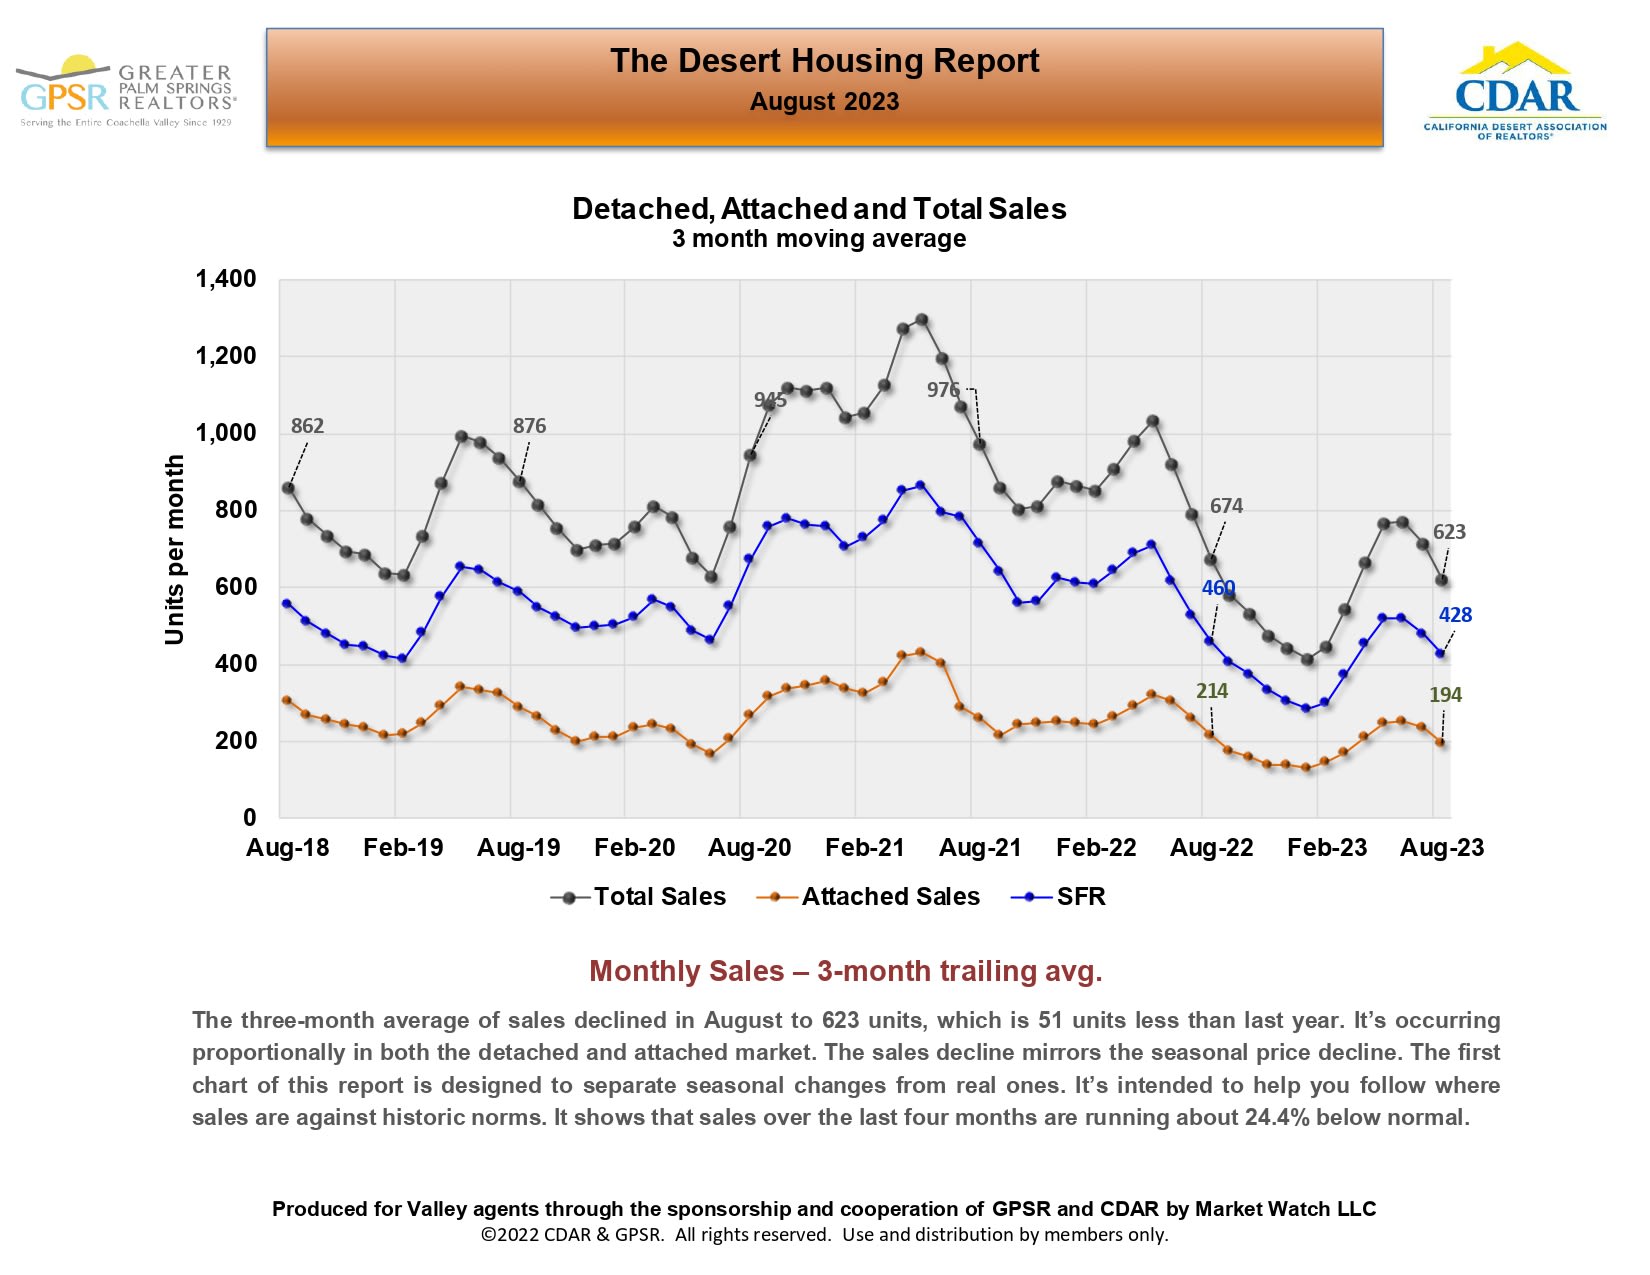
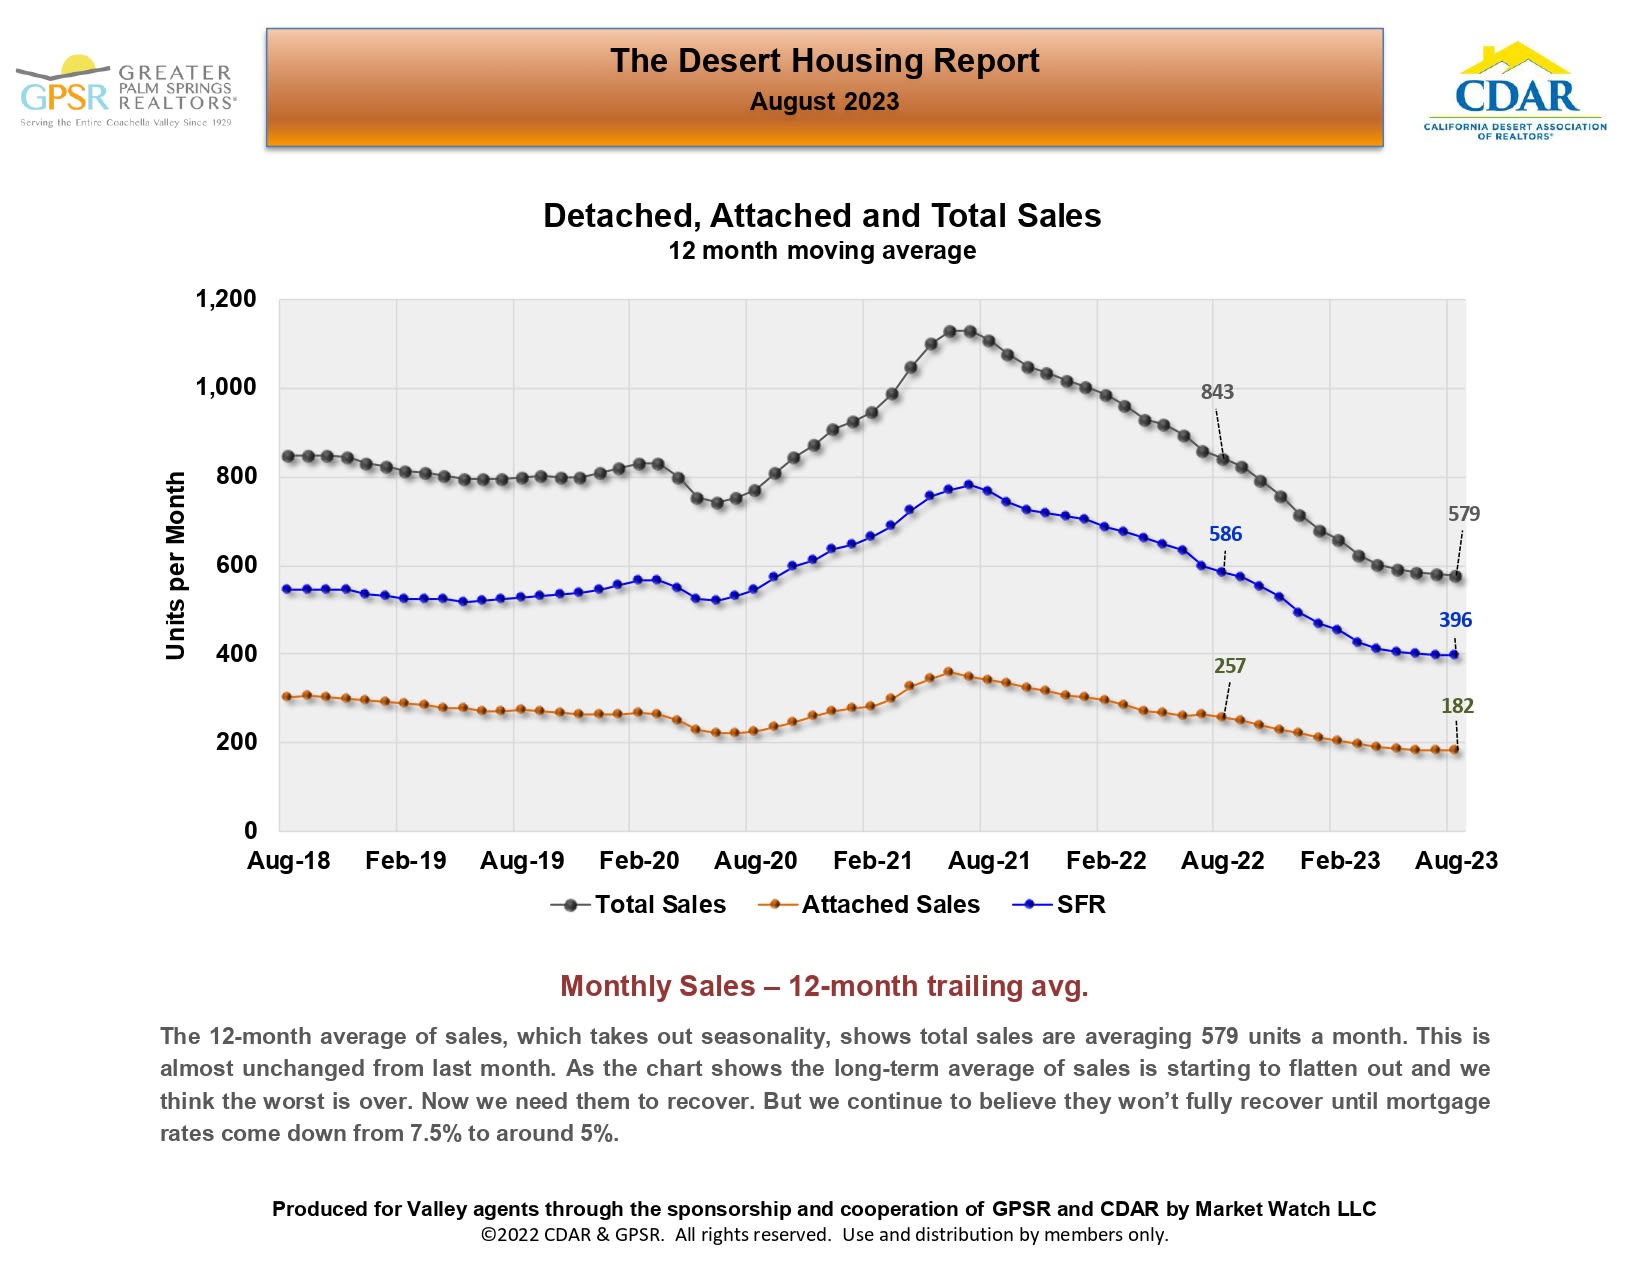
Chart of desert-area home sales, with three-month averages for total, attached, and SFR sales through August 2023.

August 2023 Desert Housing Report chart of detached, attached, and total sales trends.

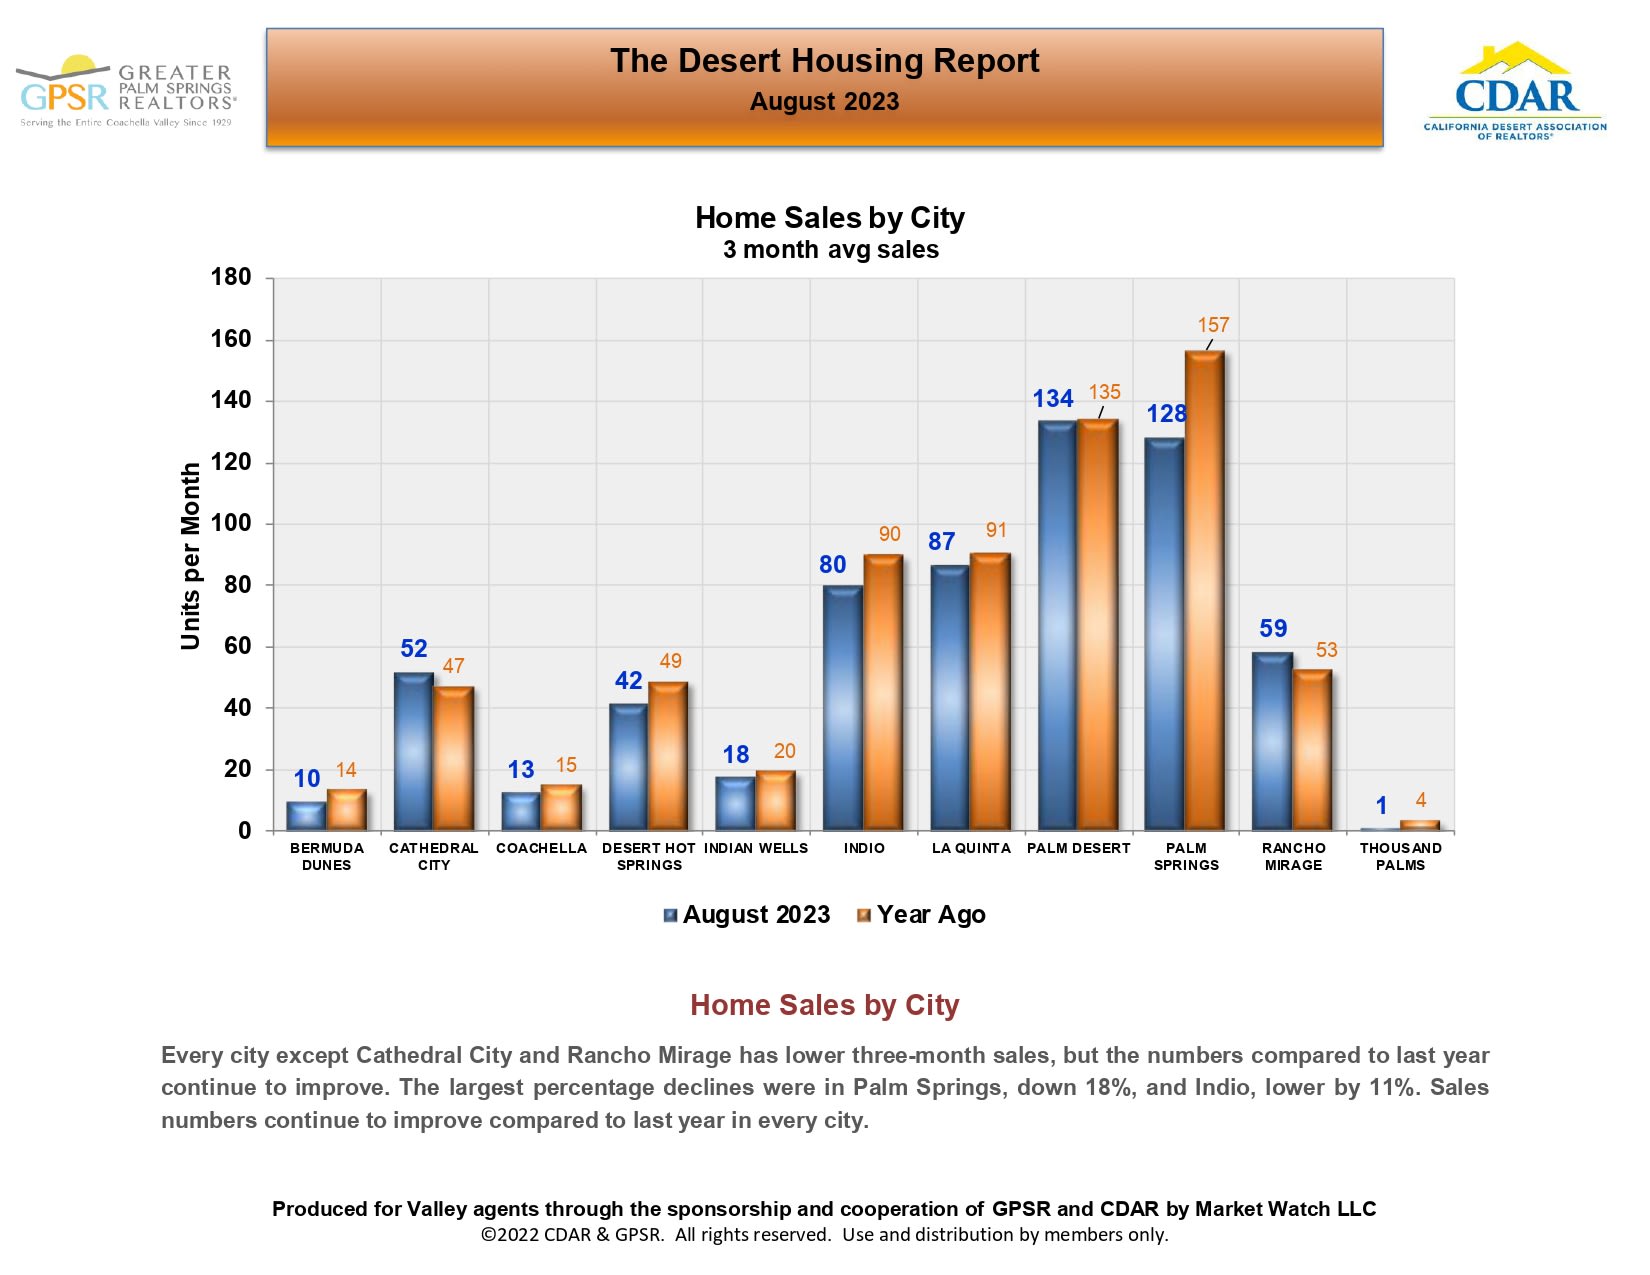
Bar chart comparing August 2023 and year-ago average monthly home sales across 11 Coachella Valley cities.

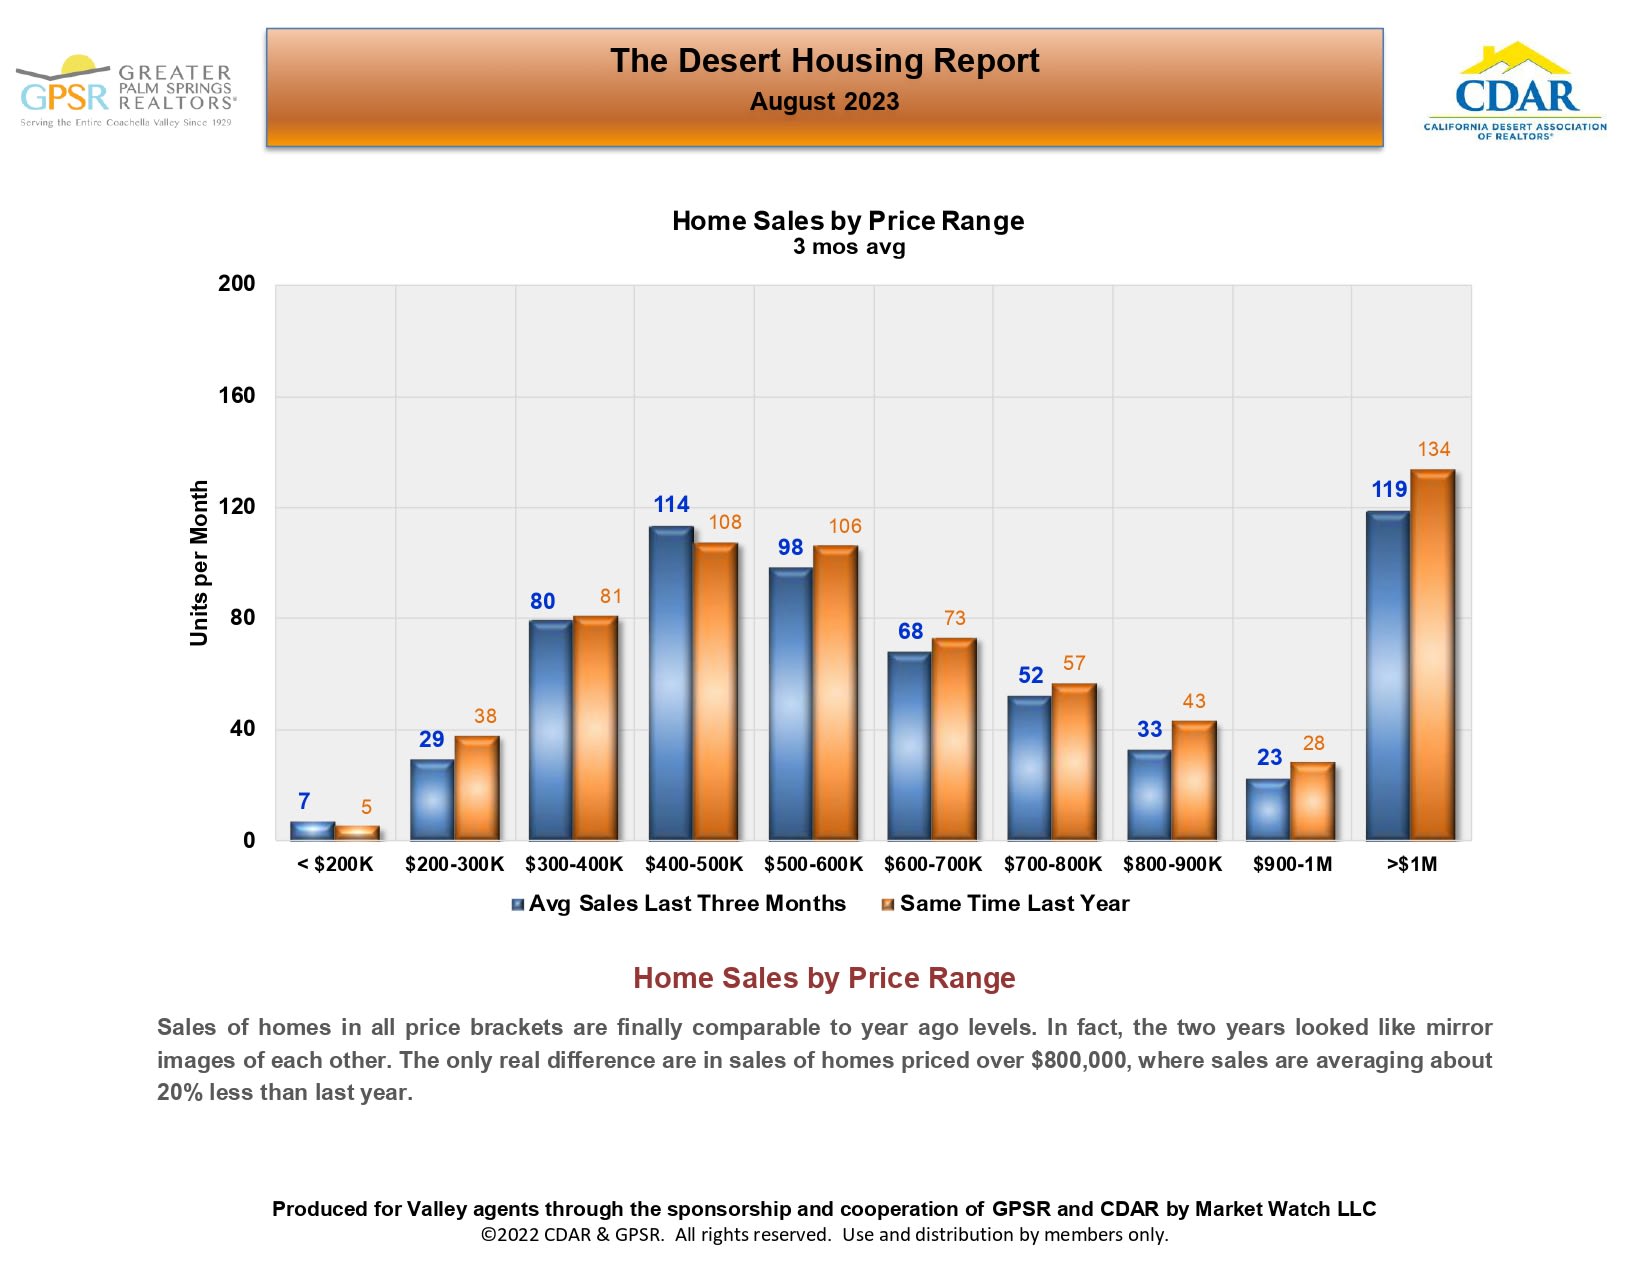
Chart comparing recent average monthly home sales with the same period last year across ten price ranges.

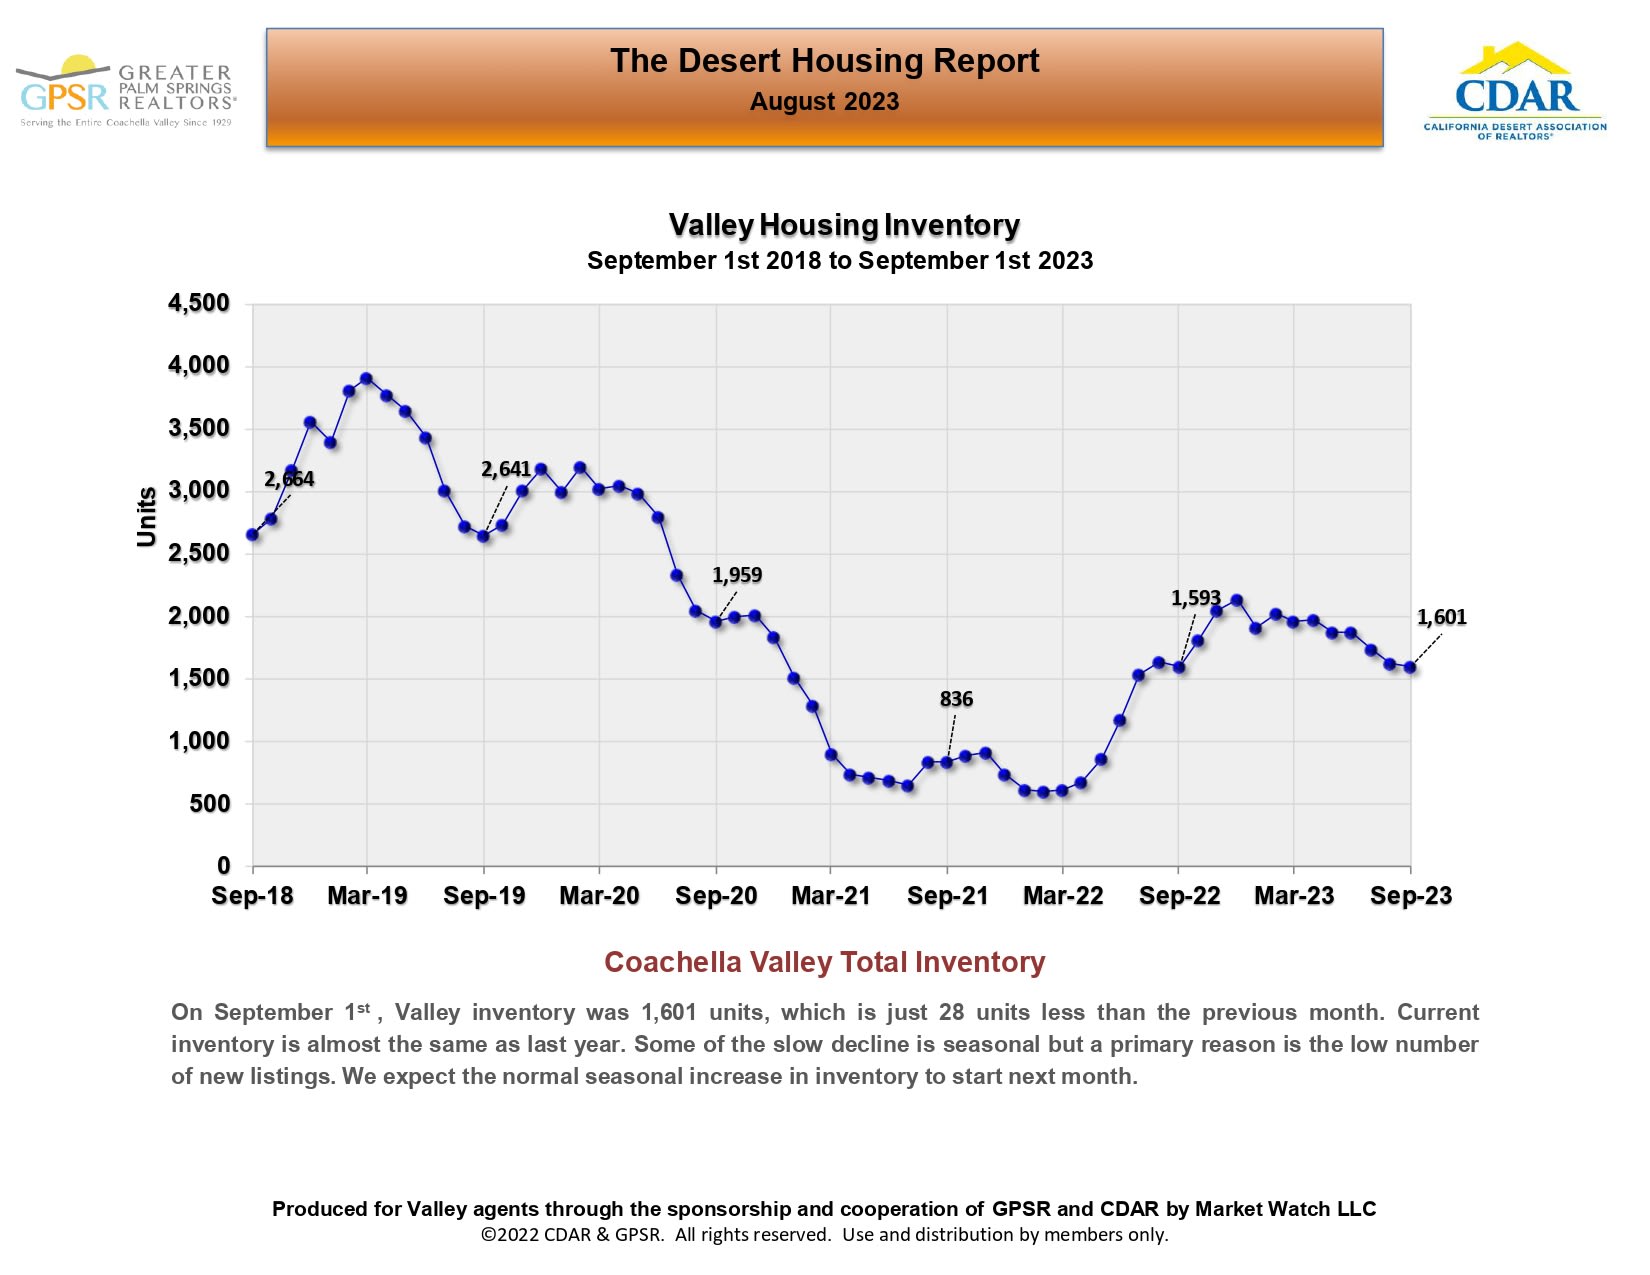
Line chart of Coachella Valley housing inventory, ending at 1,601 units in September 2023.

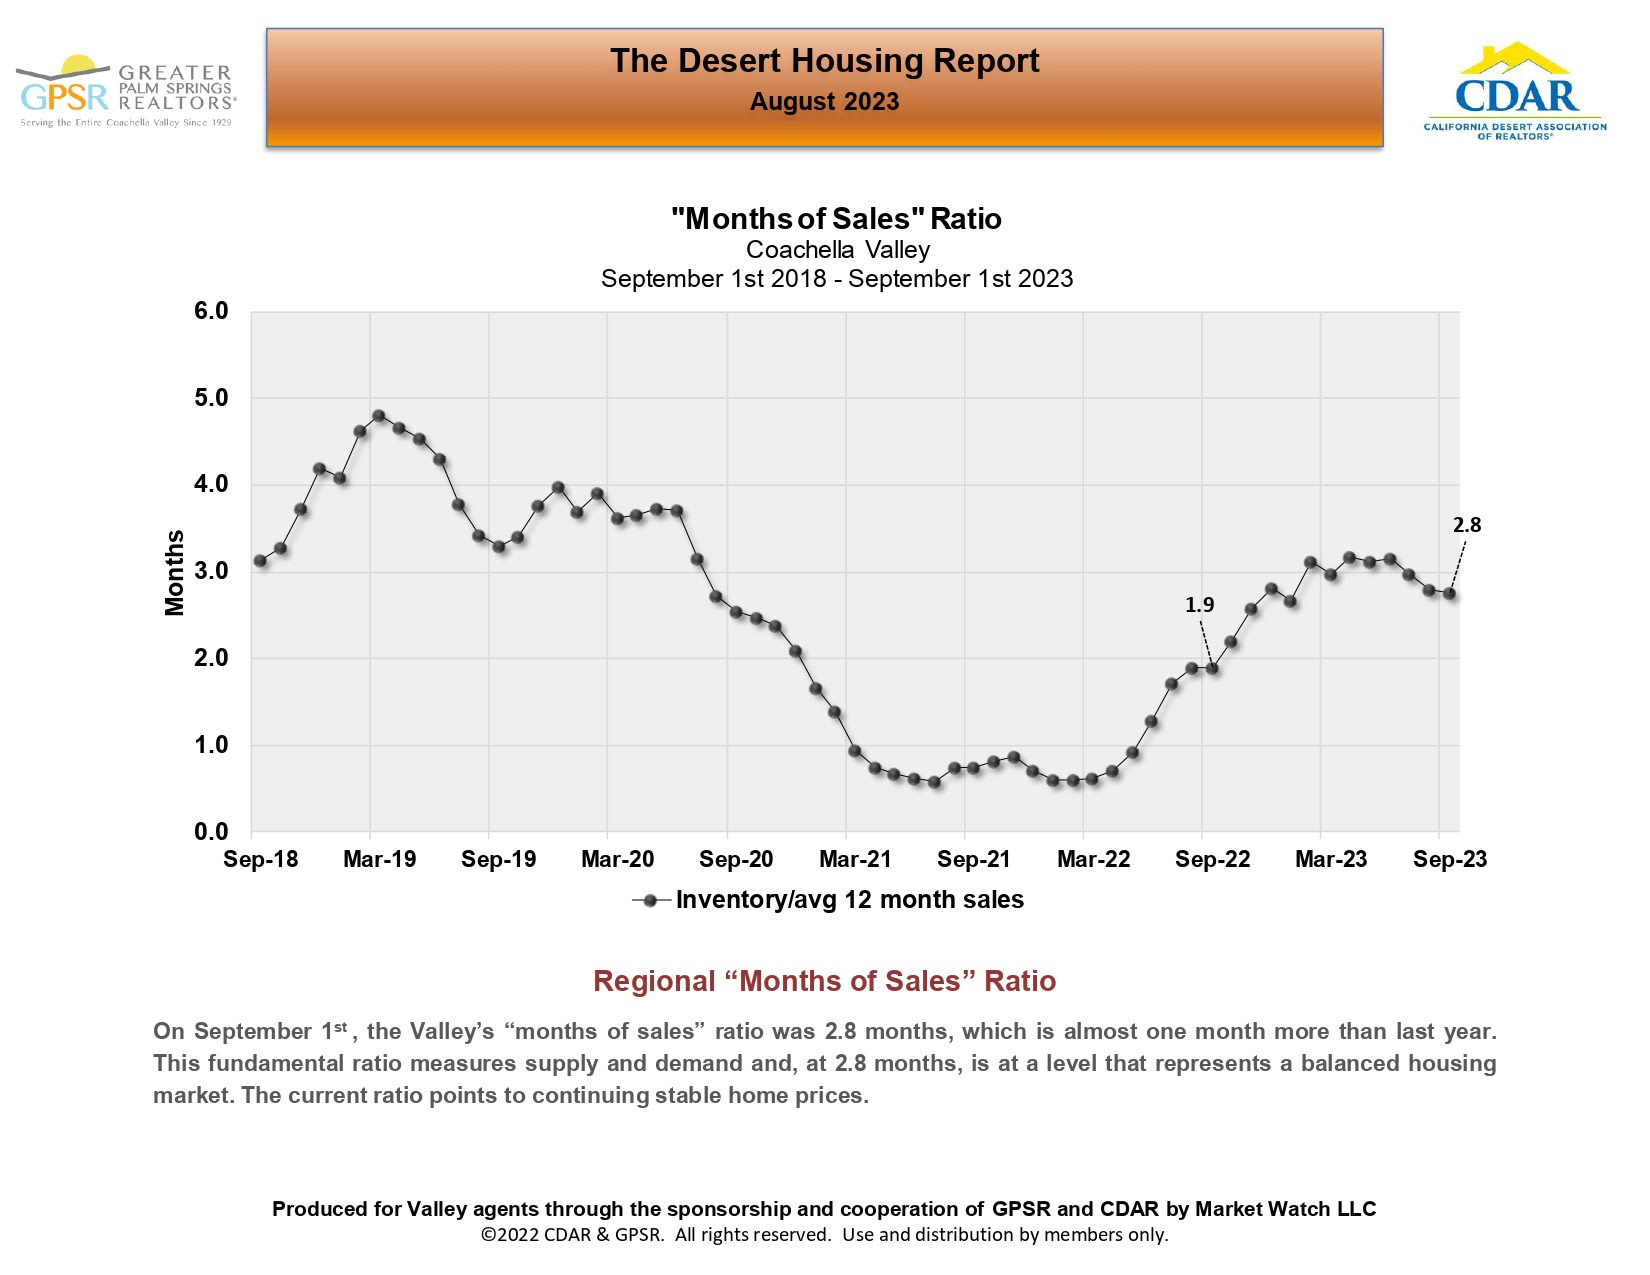
Coachella Valley months-of-sales chart, showing a 2.8-month ratio in September 2023.

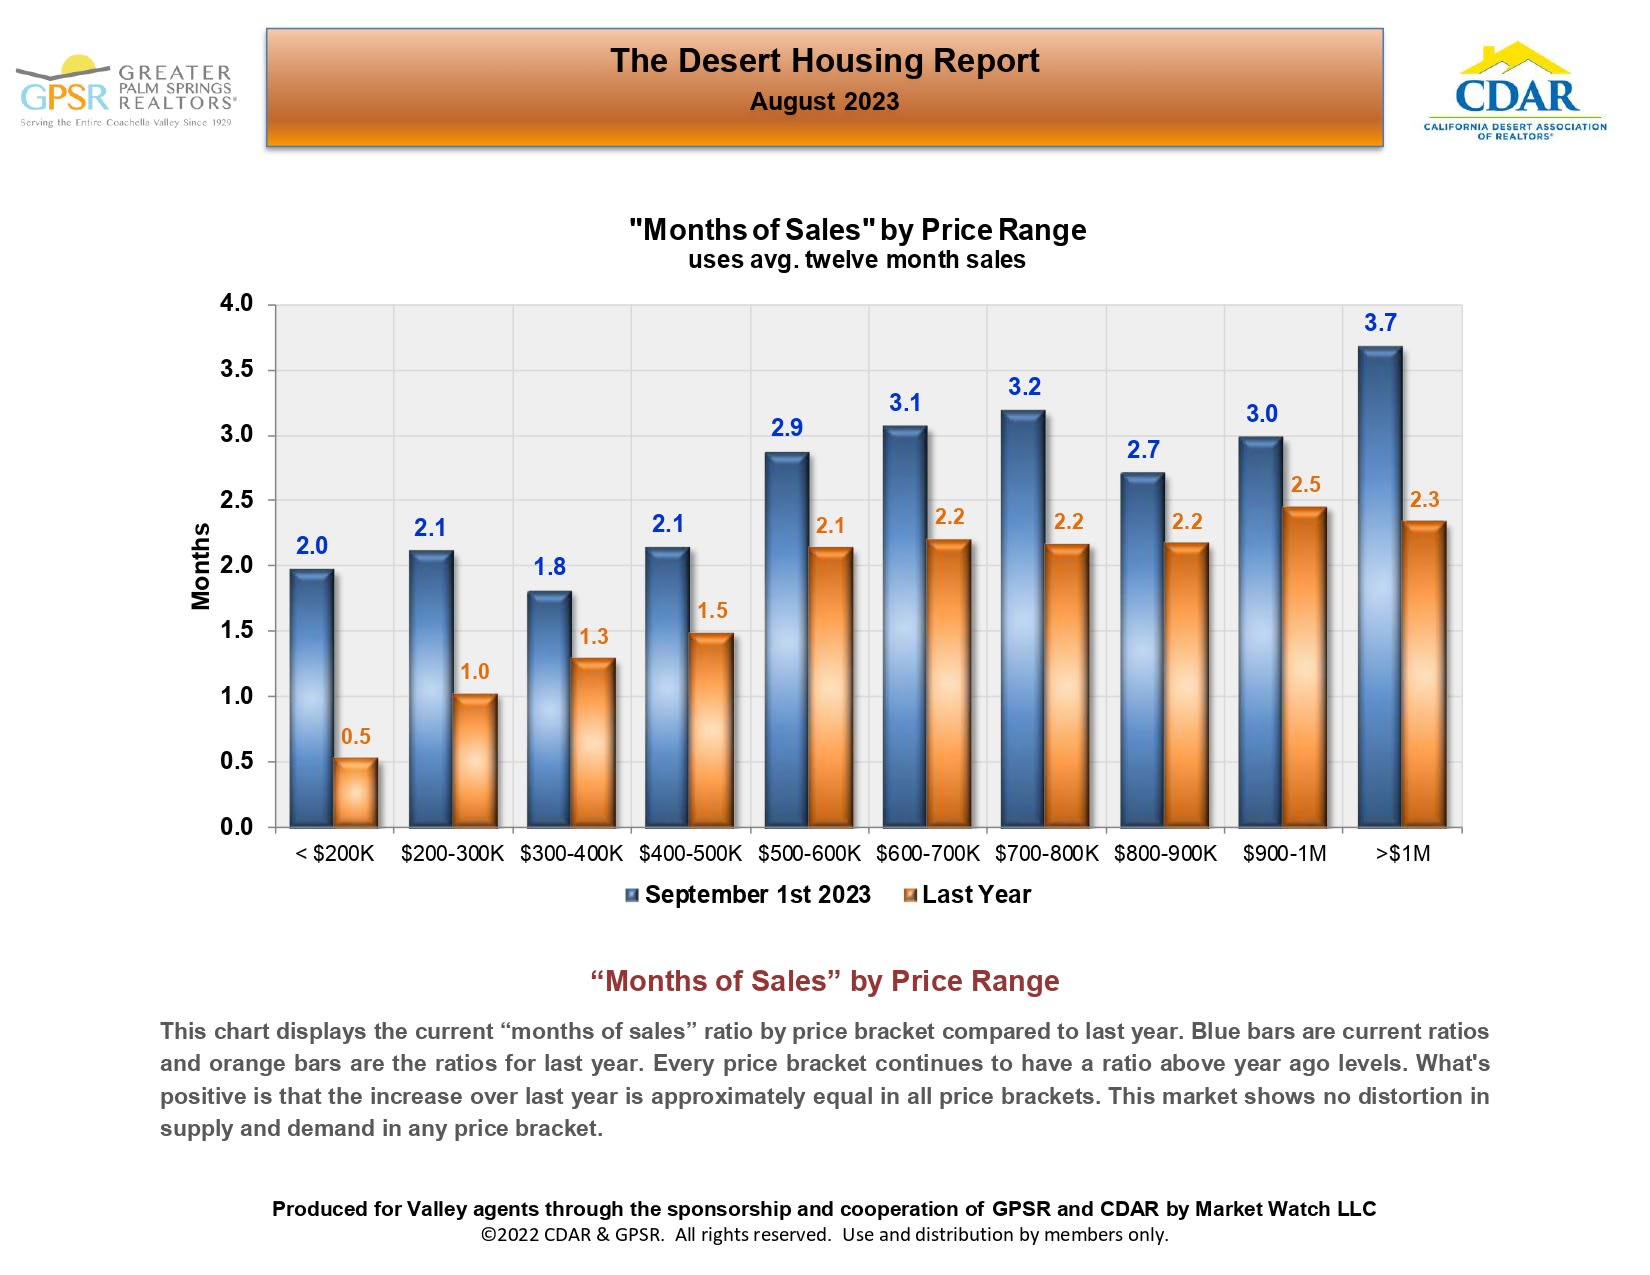
Chart comparing current and last-year months of sales across ten home price ranges.

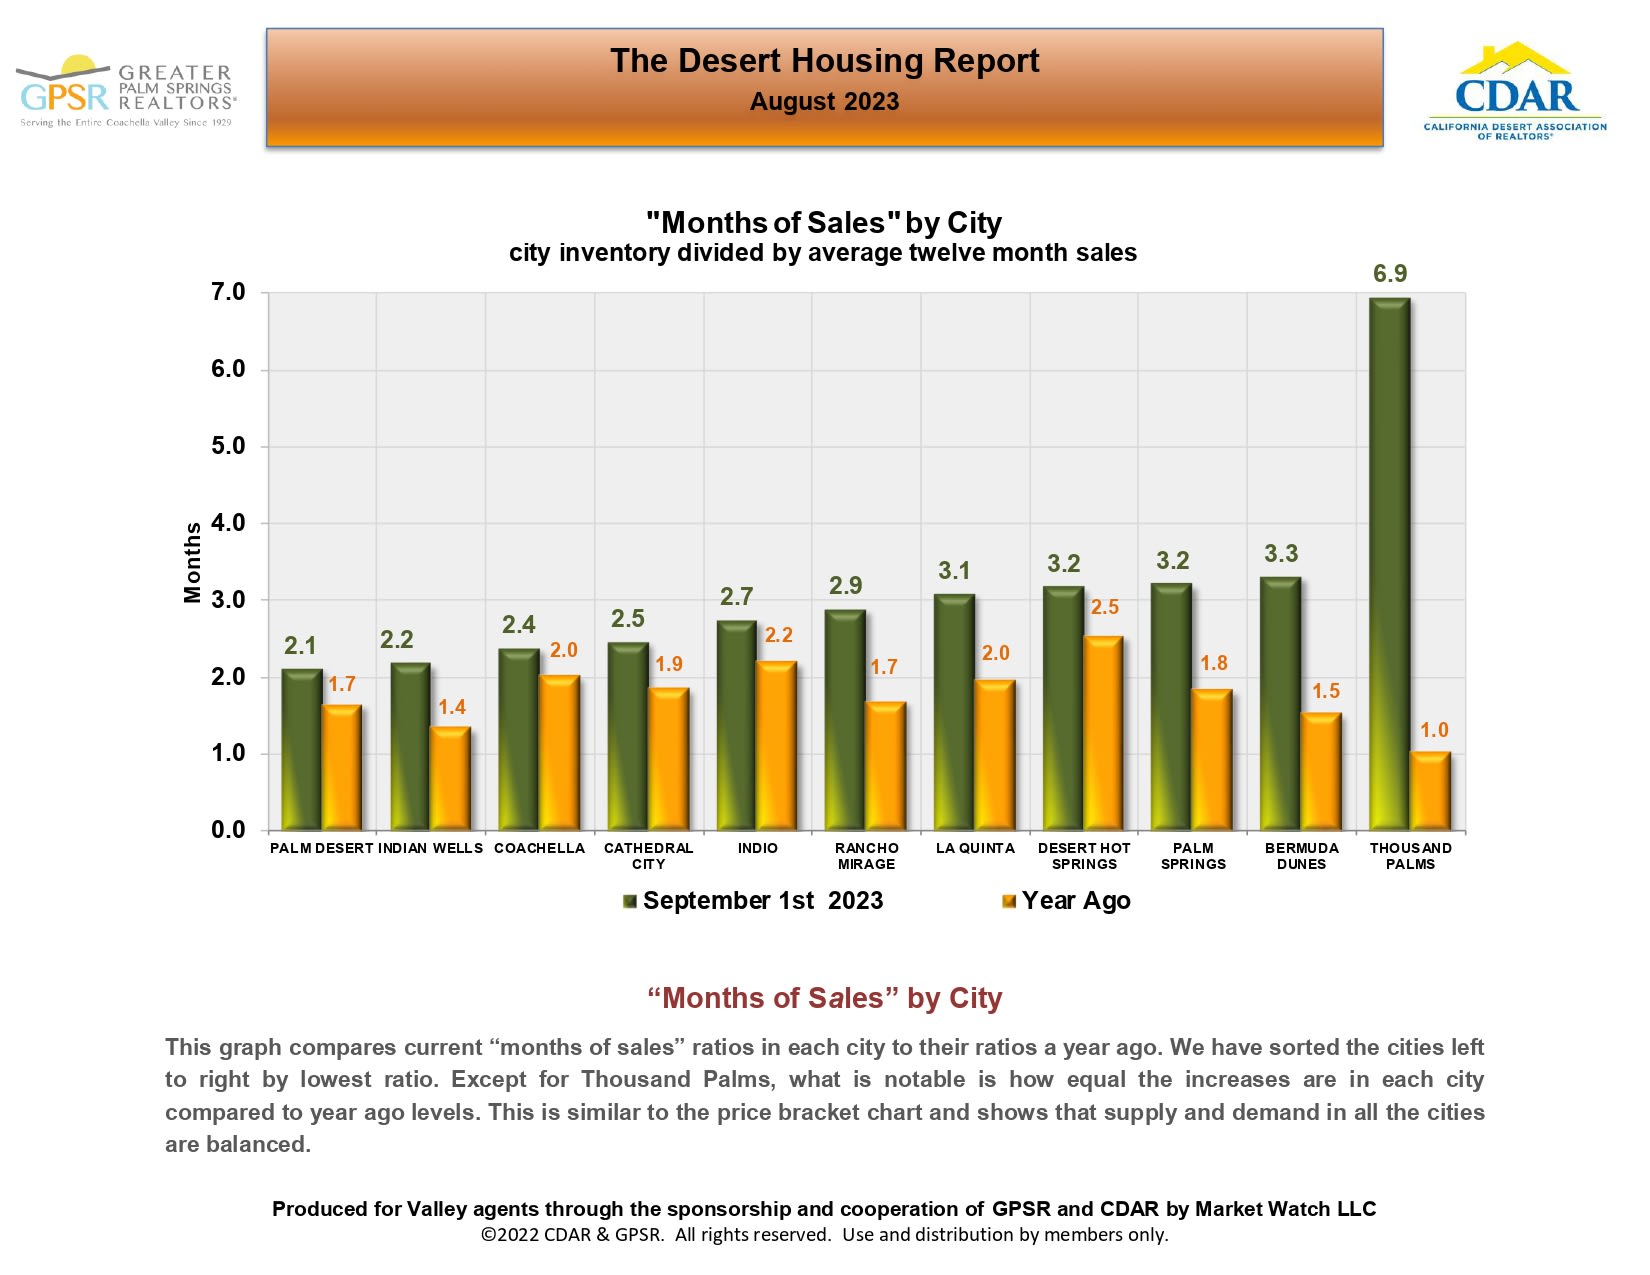
Chart comparing current months of sales with year-ago figures across eleven Coachella Valley cities.

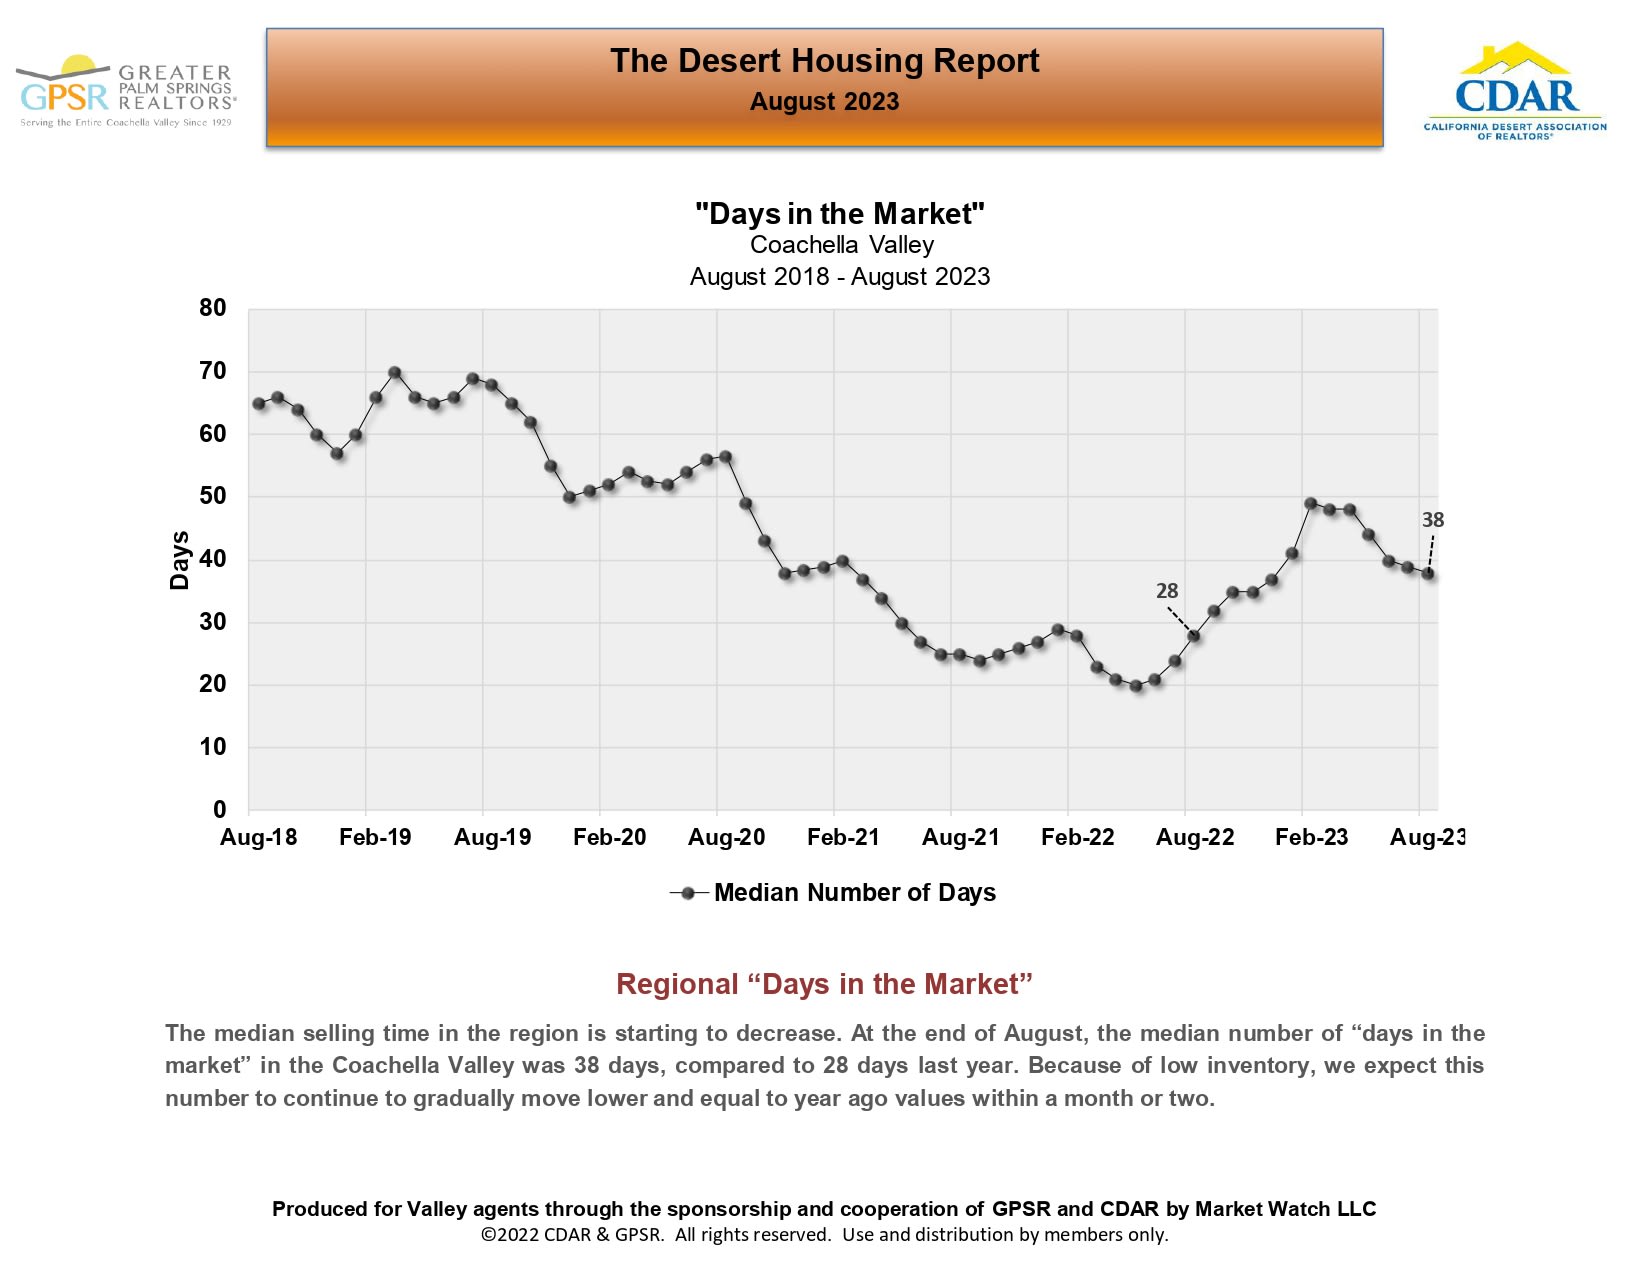
Coachella Valley median days on market, charted from August 2018 to August 2023, ending at 38 days.

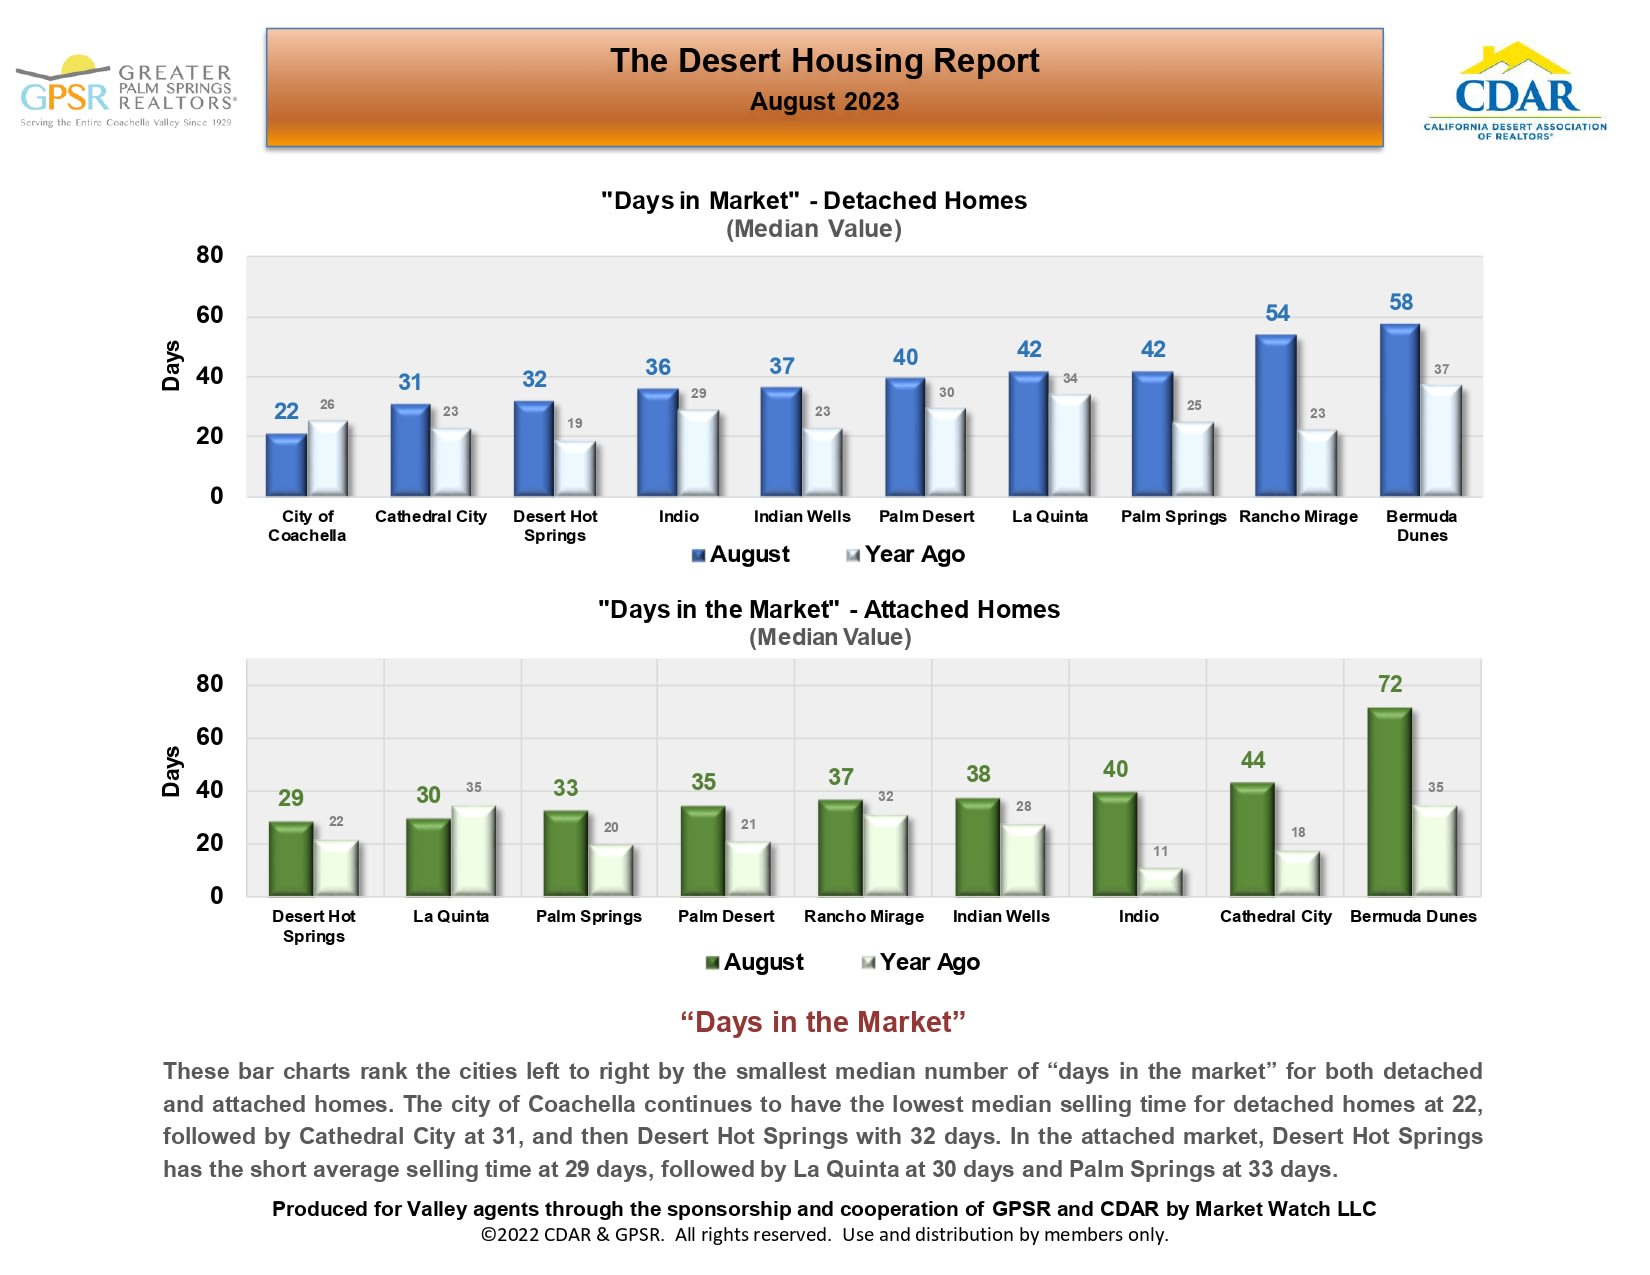
August 2023 Desert Housing Report charts compare days on market for detached and attached homes.

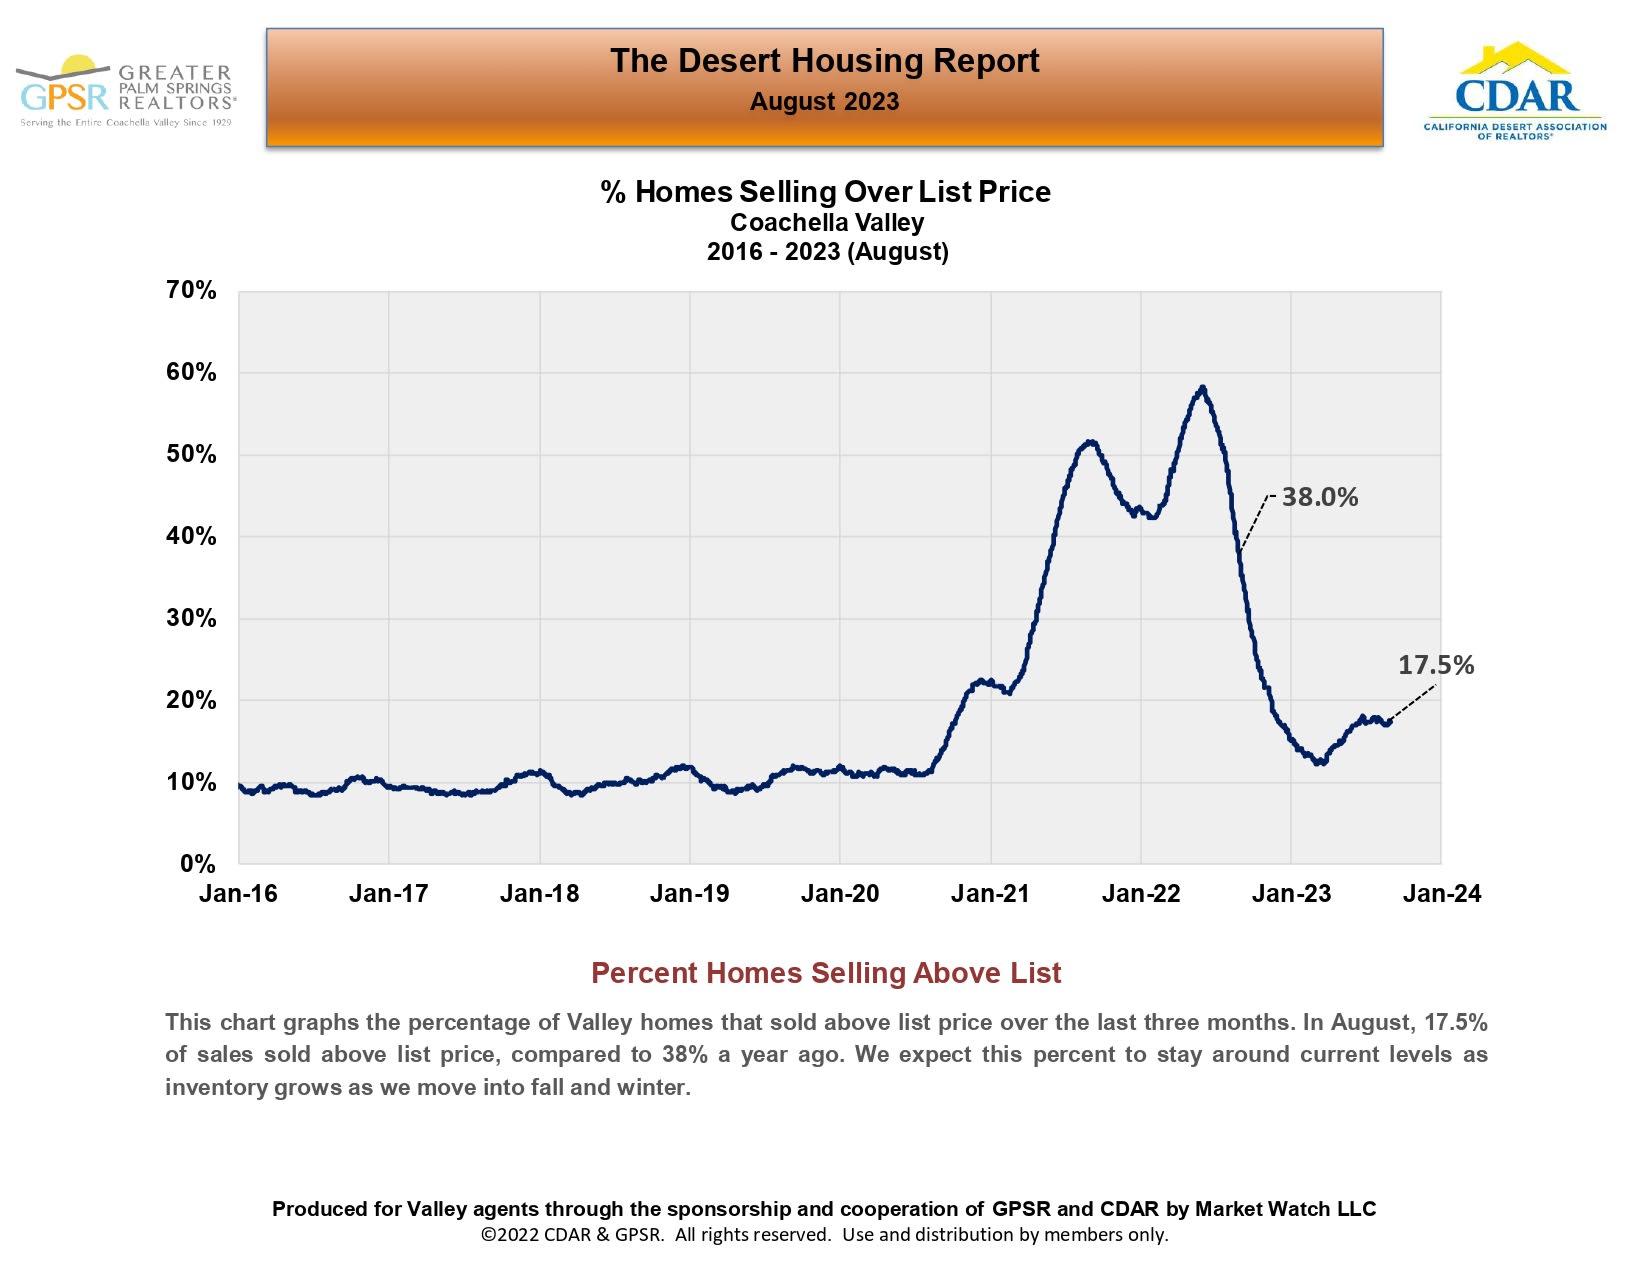
Chart of Coachella Valley homes selling above list price, falling from 38% in August 2022 to 17.5% in August 2023.

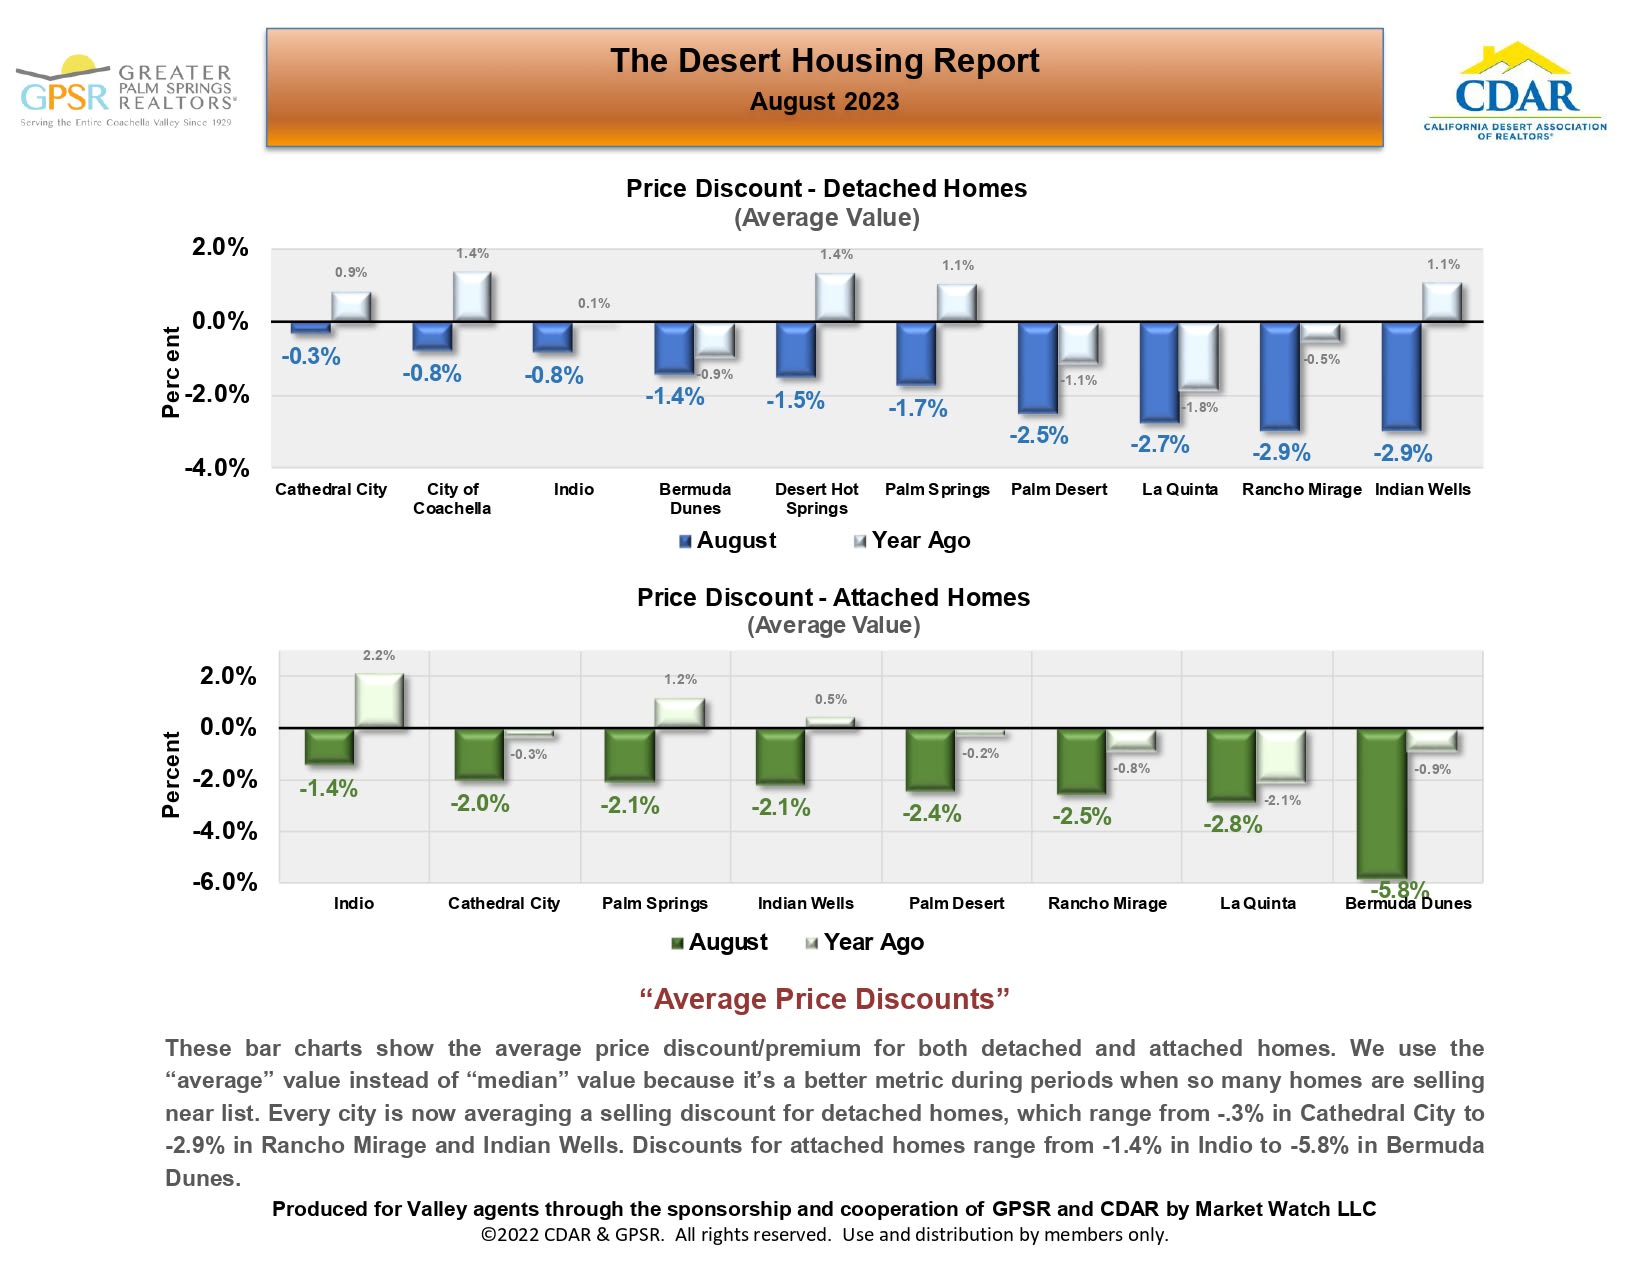
August 2023 Desert Housing Report comparing detached- and attached-home price discounts across Coachella Valley cities.

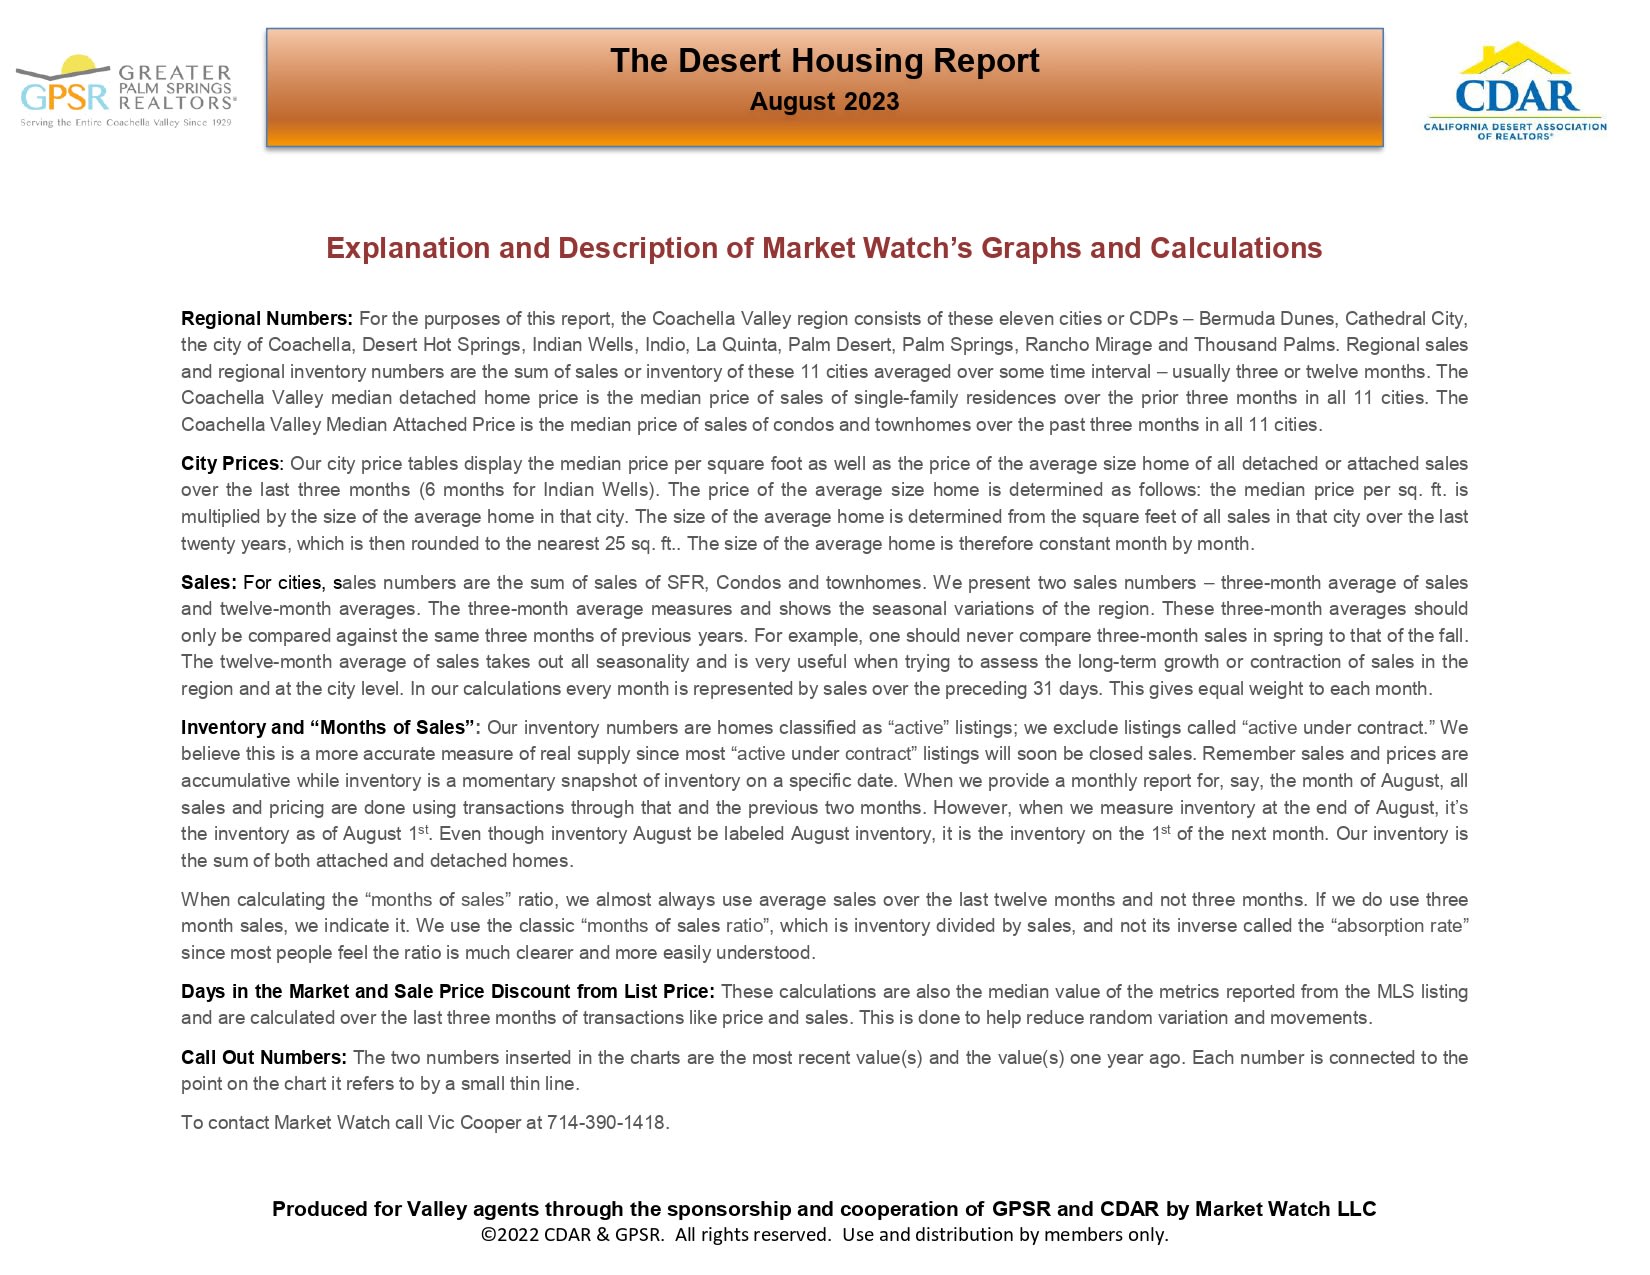
August 2023 Desert Housing Report page explaining Coachella Valley market graphs and calculations.

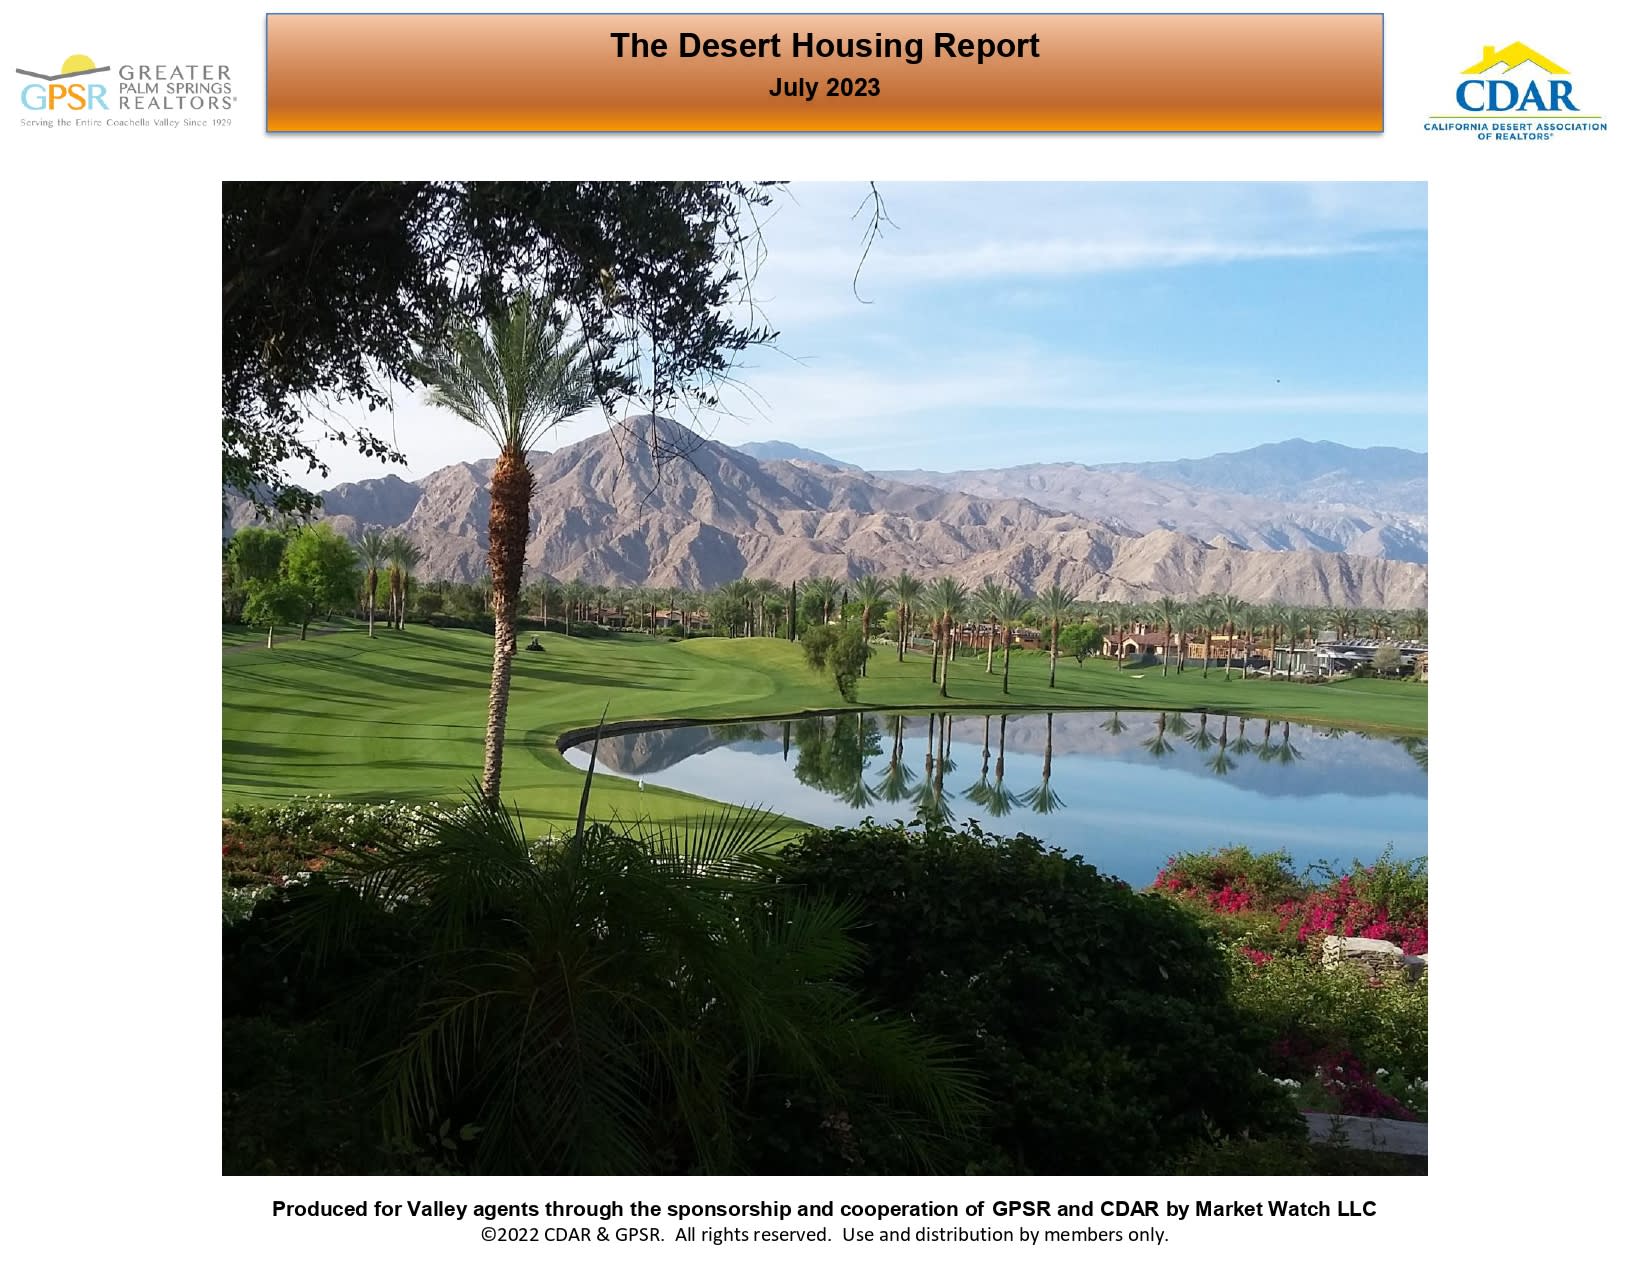
July 2023 Desert Housing Report cover with a palm-lined golf course, reflective pond, and desert mountains.


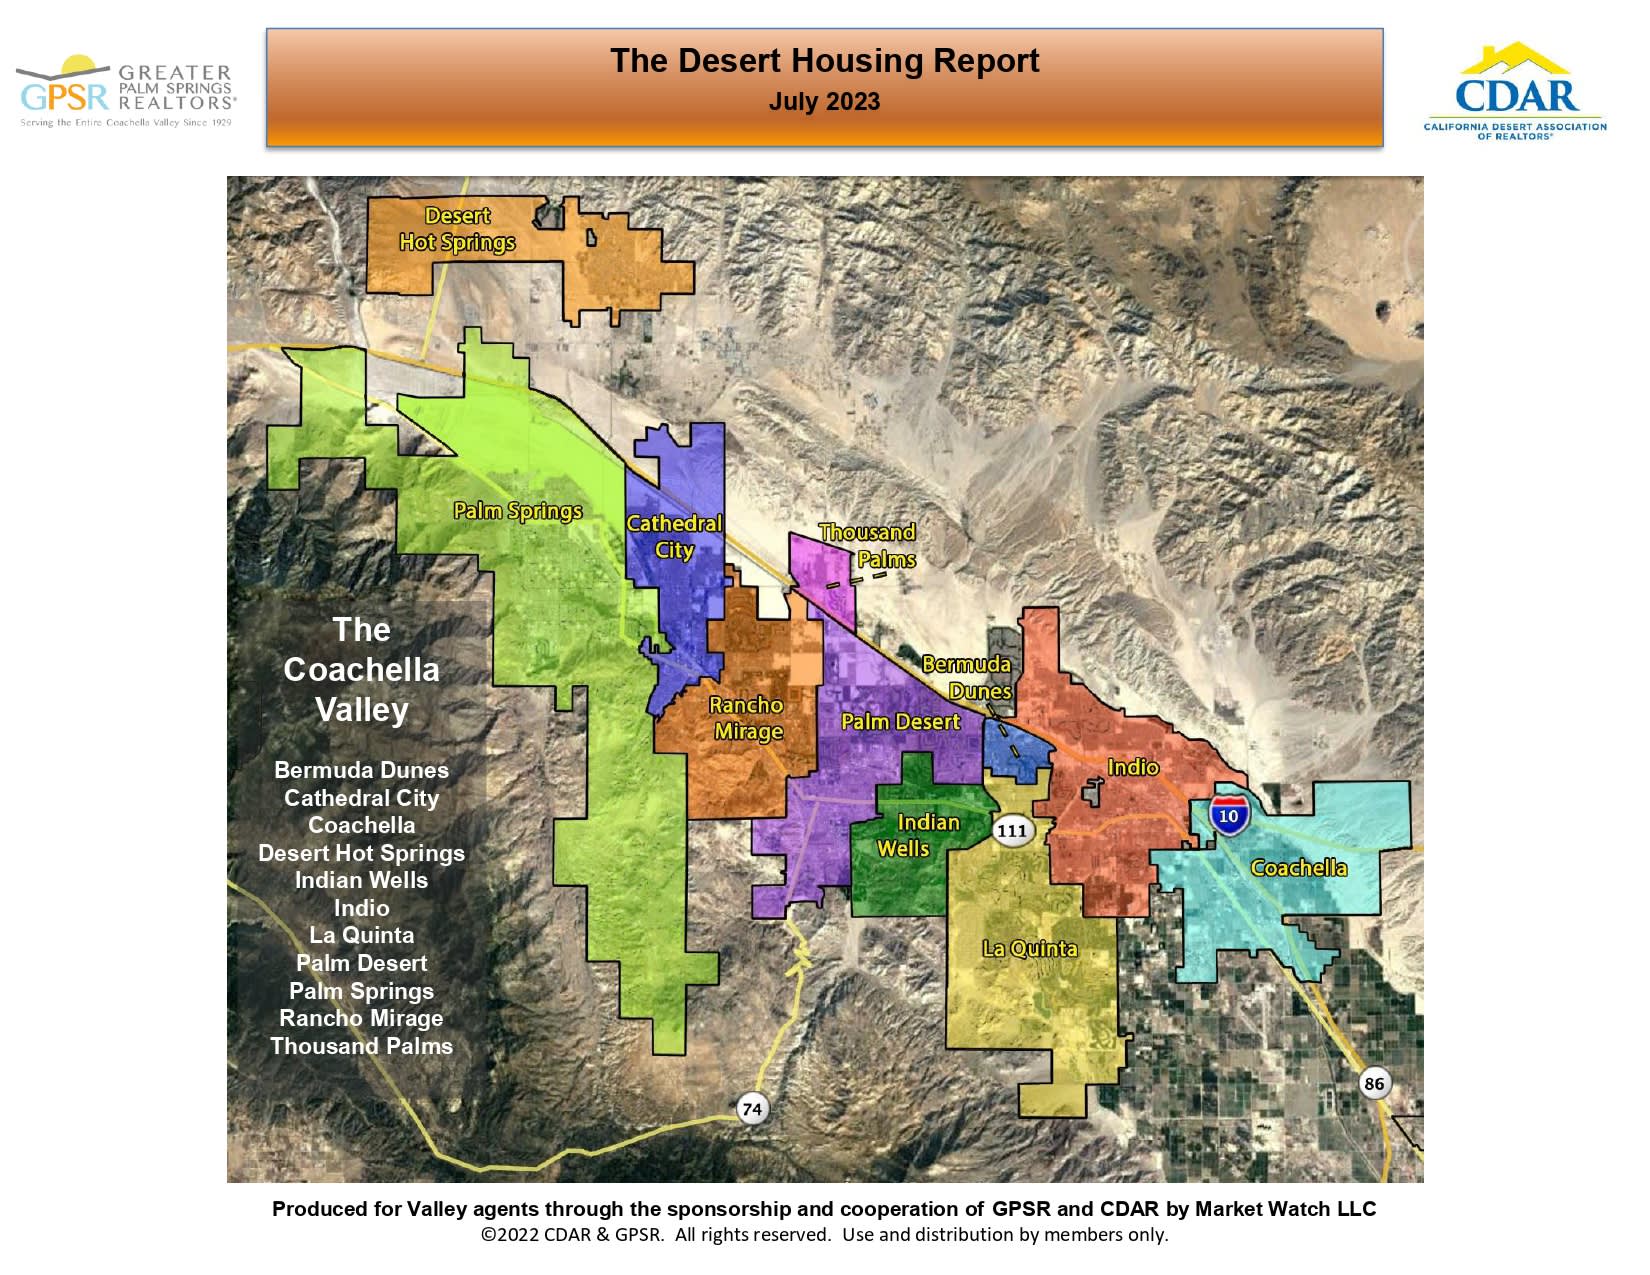
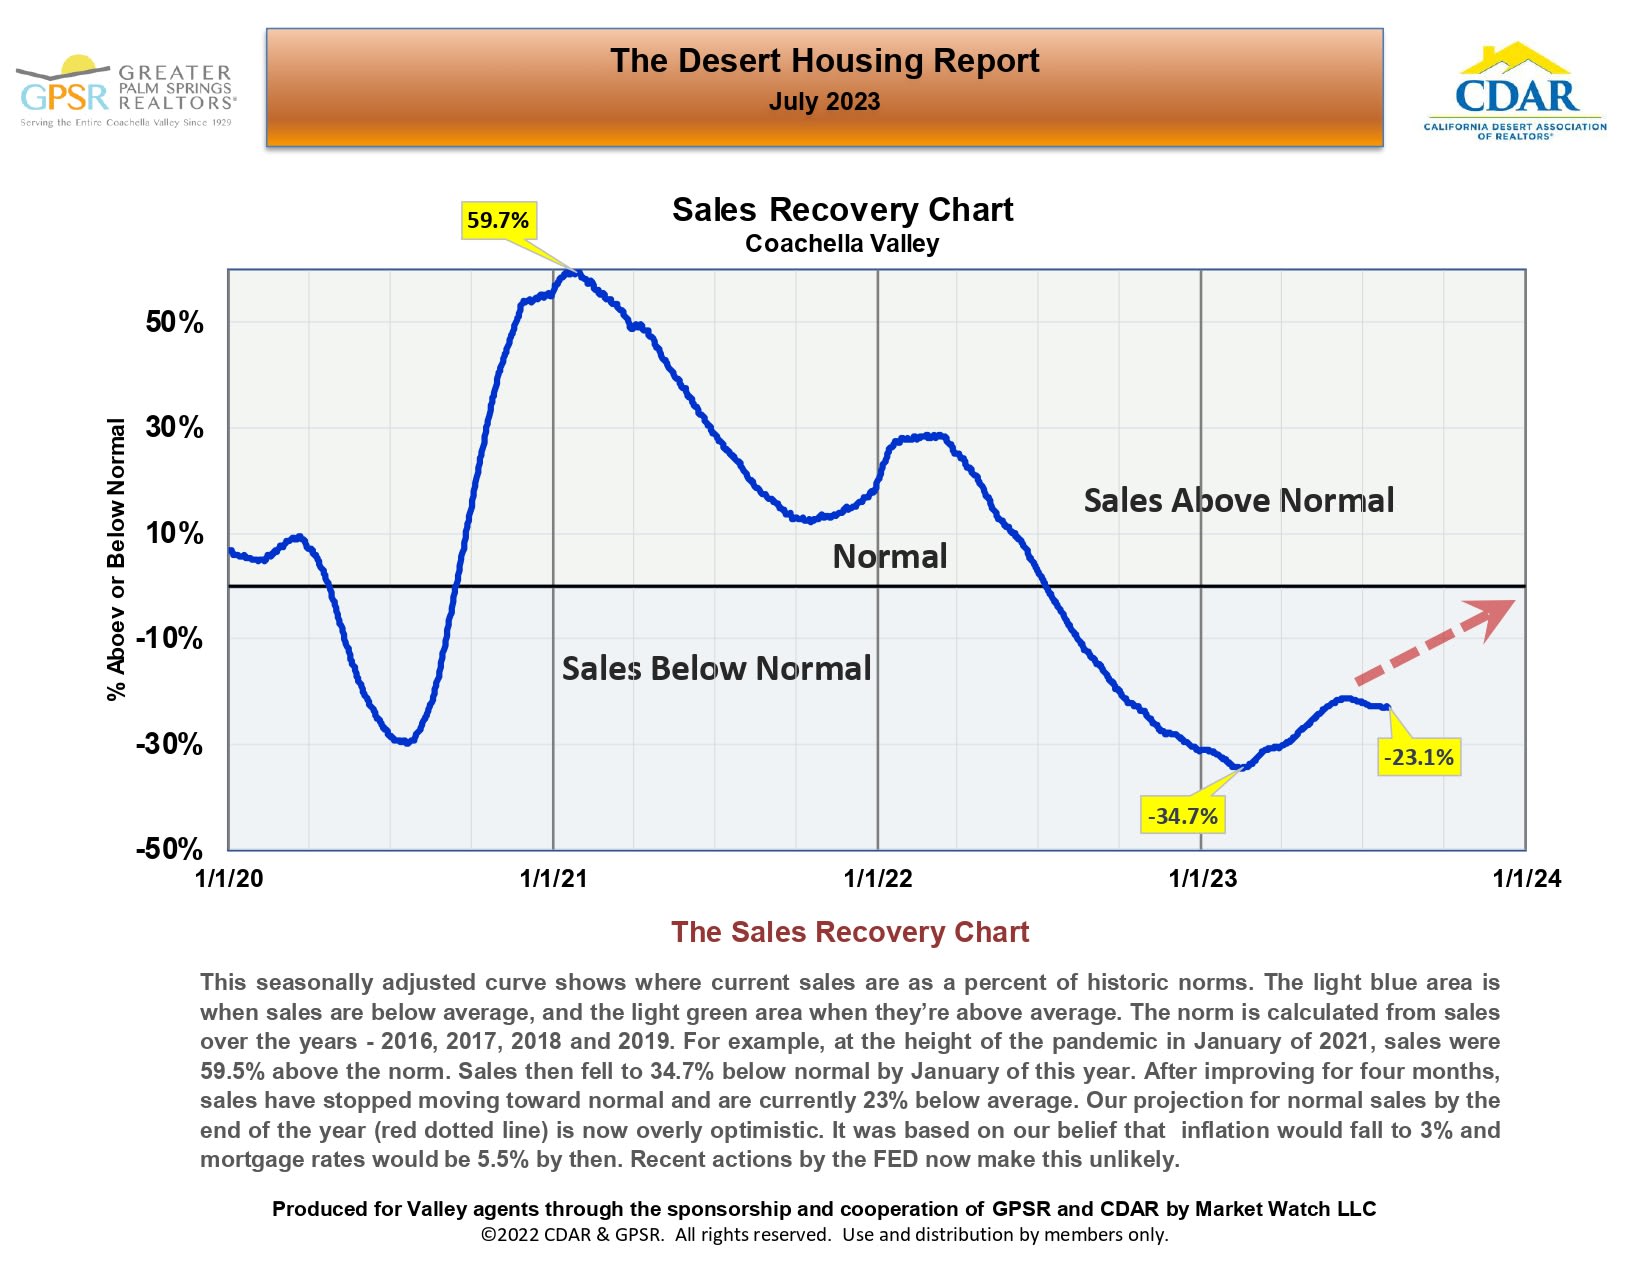
Map of Coachella Valley cities with colored boundaries, from the July 2023 Desert Housing Report.Coachella Valley sales recovery chart, showing sales below normal in 2023 and a dotted projection toward 2024.
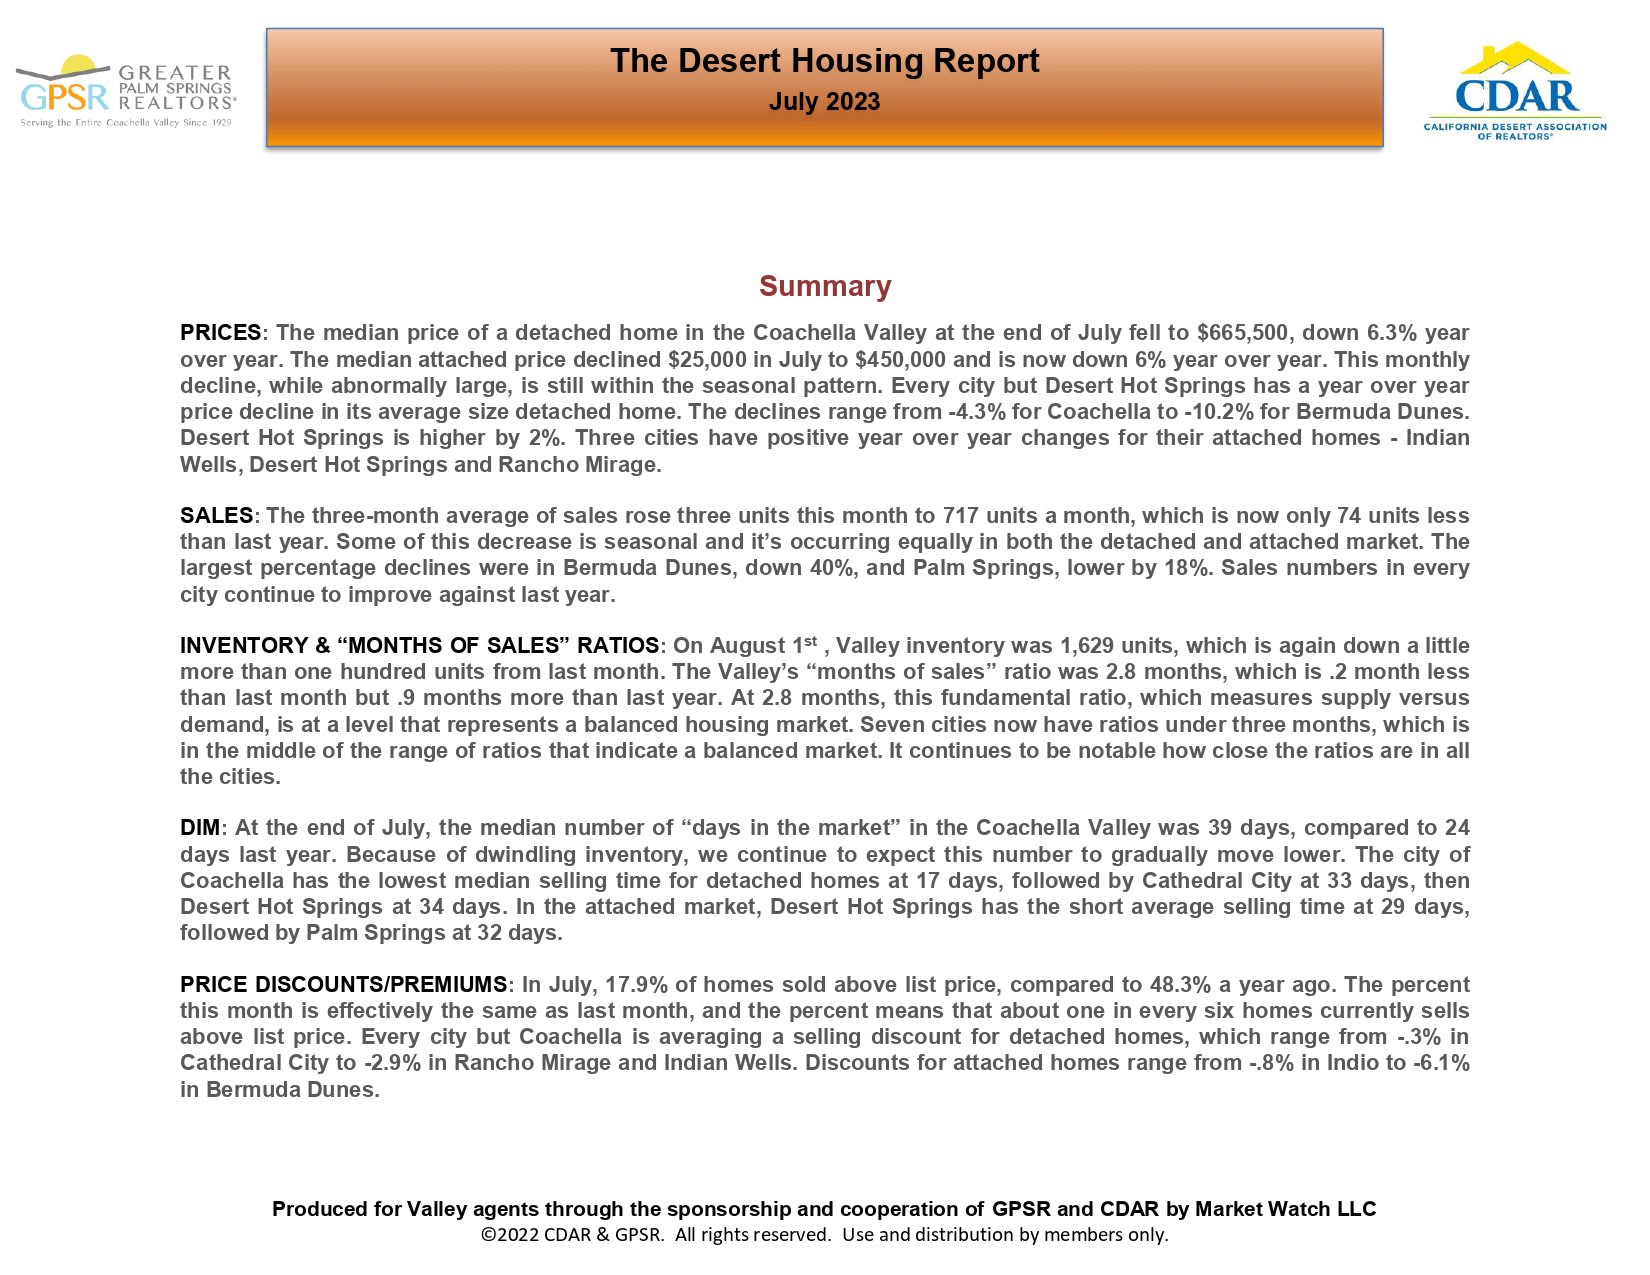
July 2023 Desert Housing Report summary of Coachella Valley prices, sales, inventory, days on market, and price discounts.
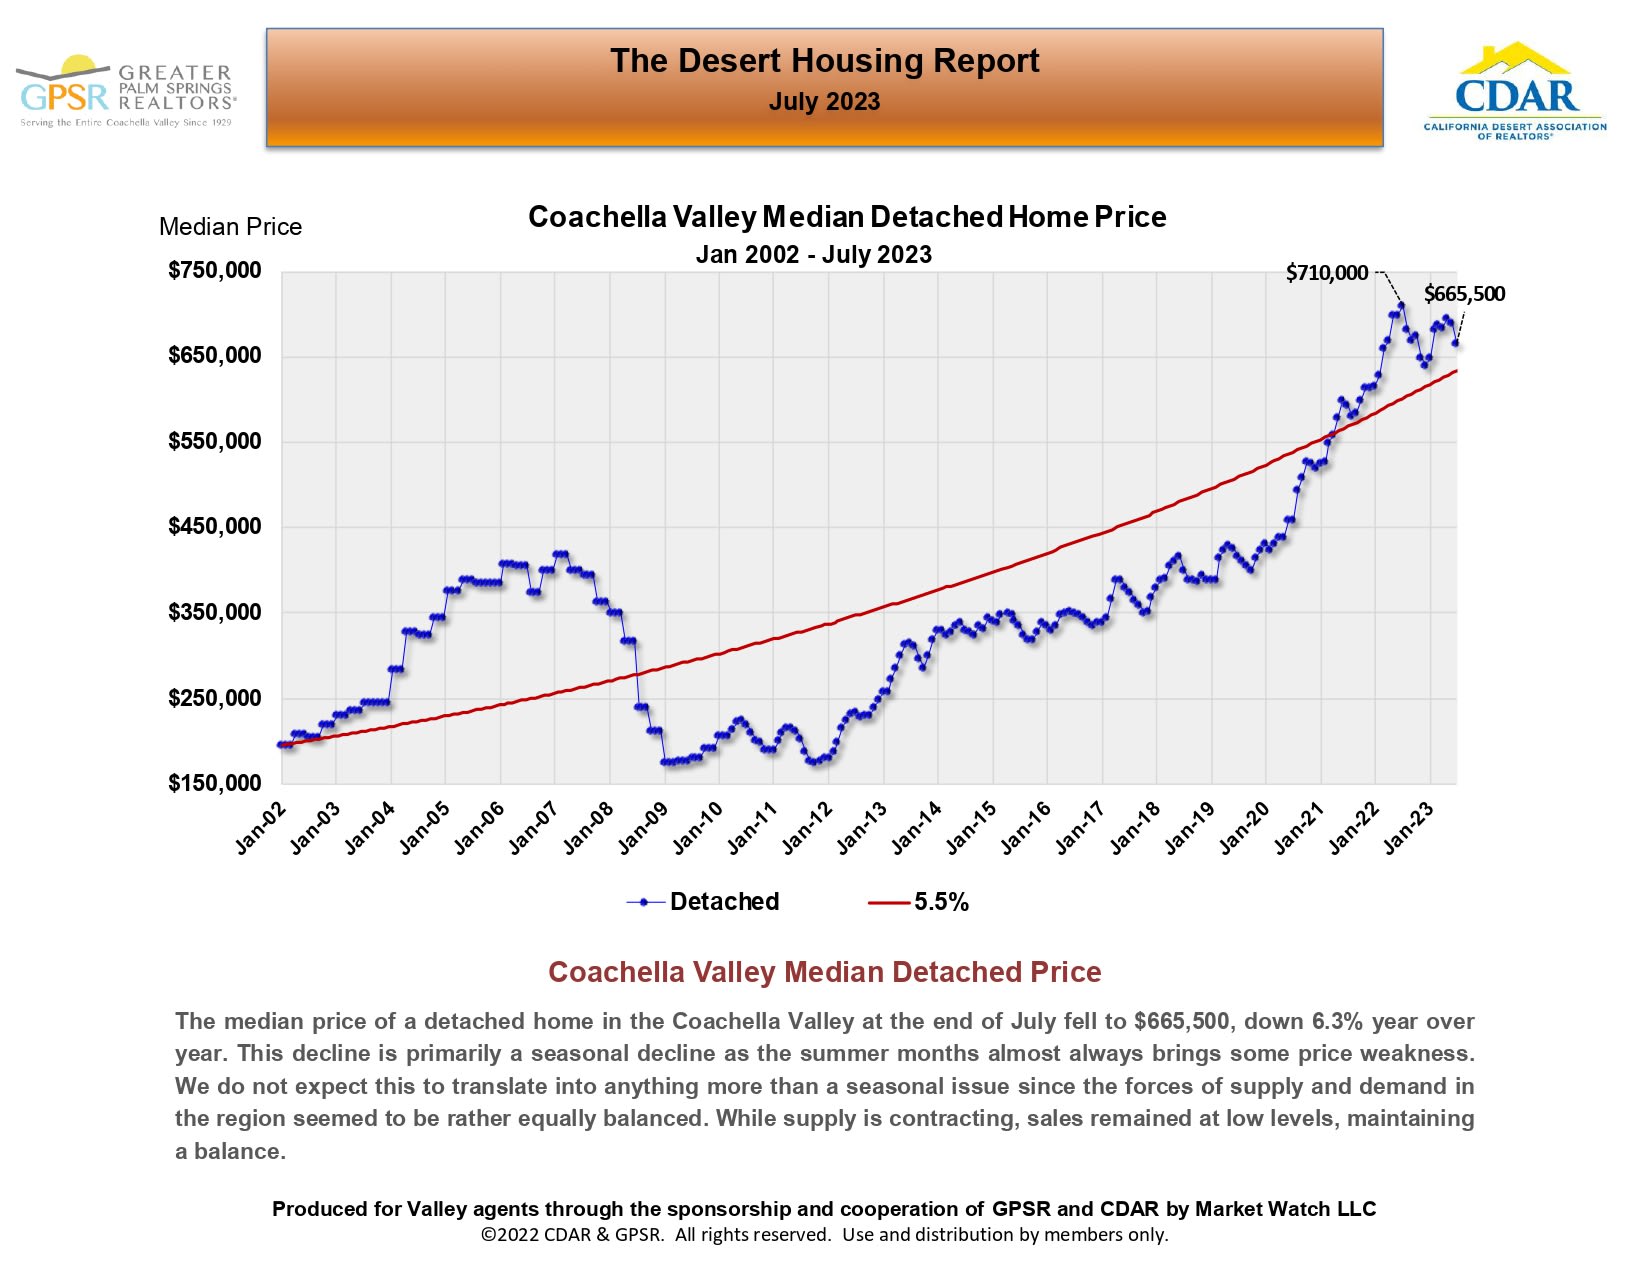
Chart of Coachella Valley detached home prices from 2002 to July 2023, with a 5.5% trend line.
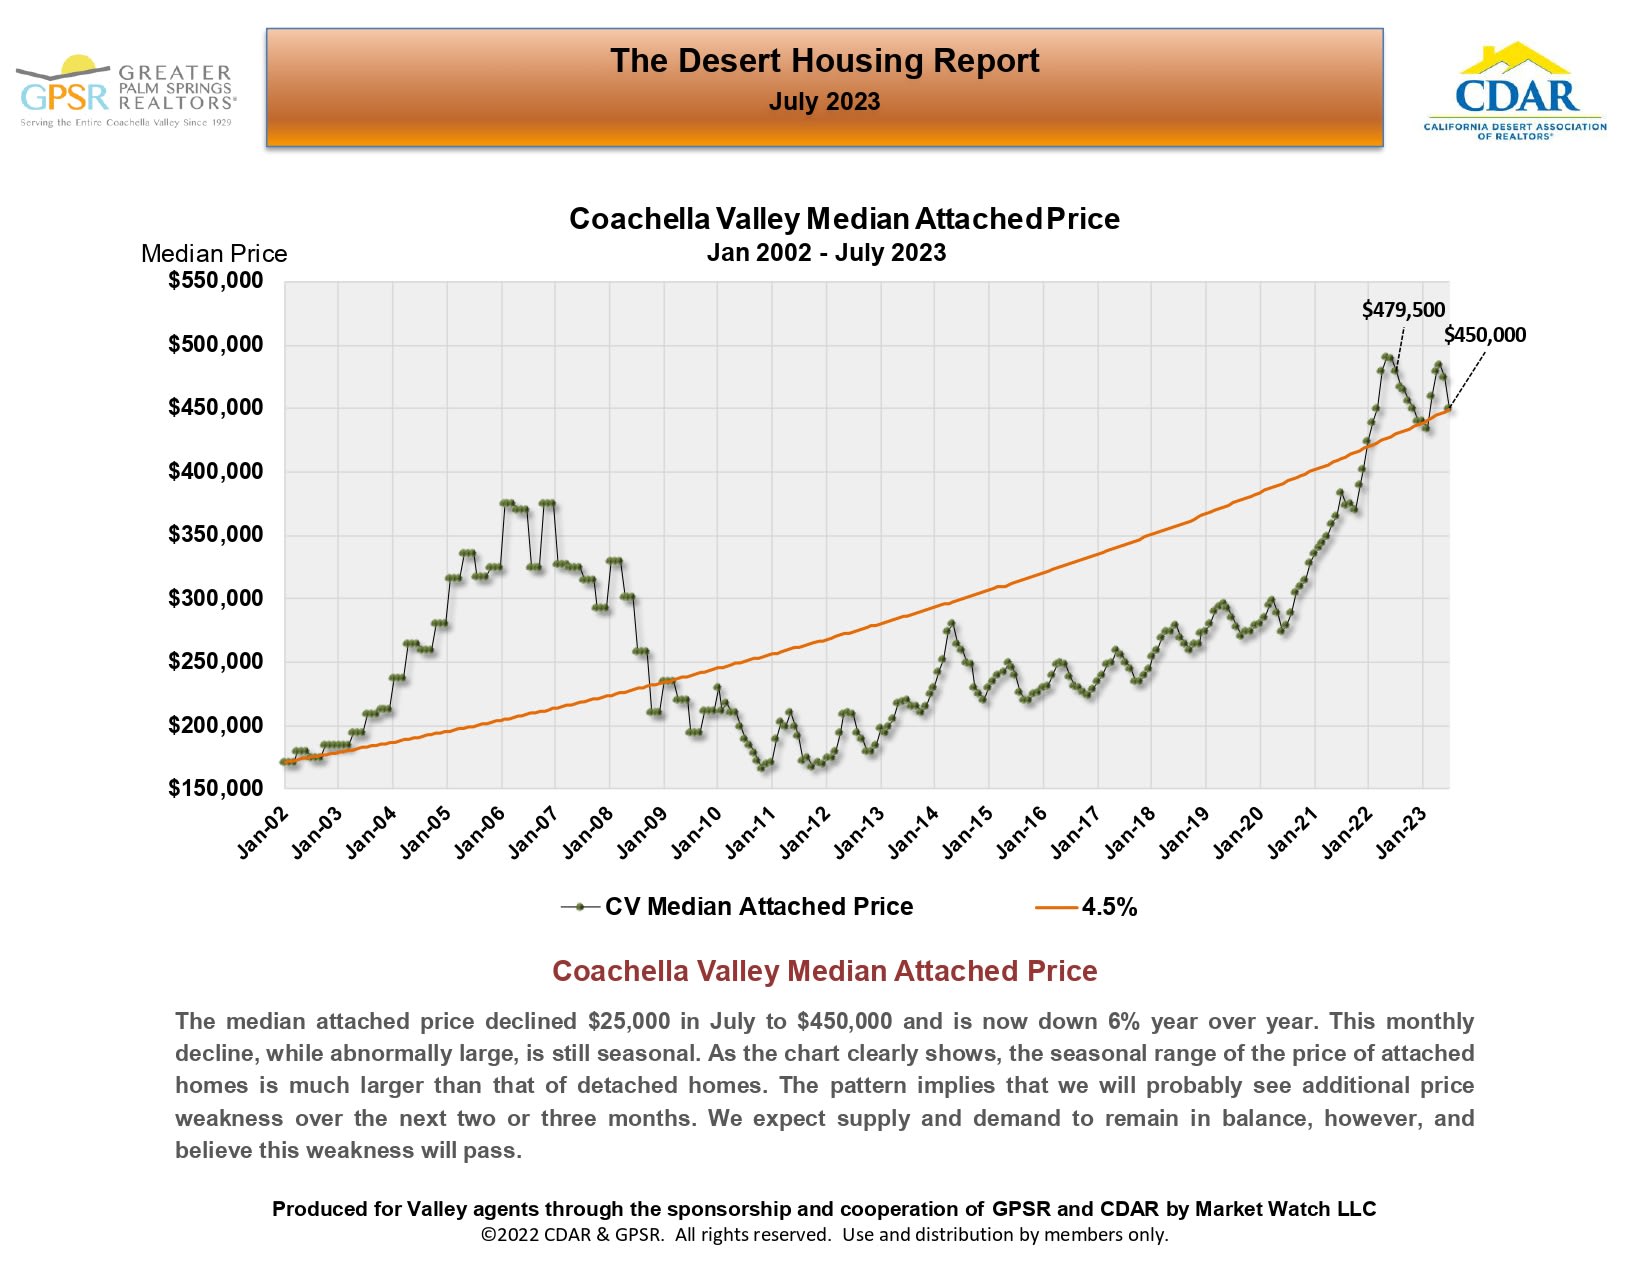
Chart of Coachella Valley median attached-home prices, January 2002–July 2023, ending at $450,000.
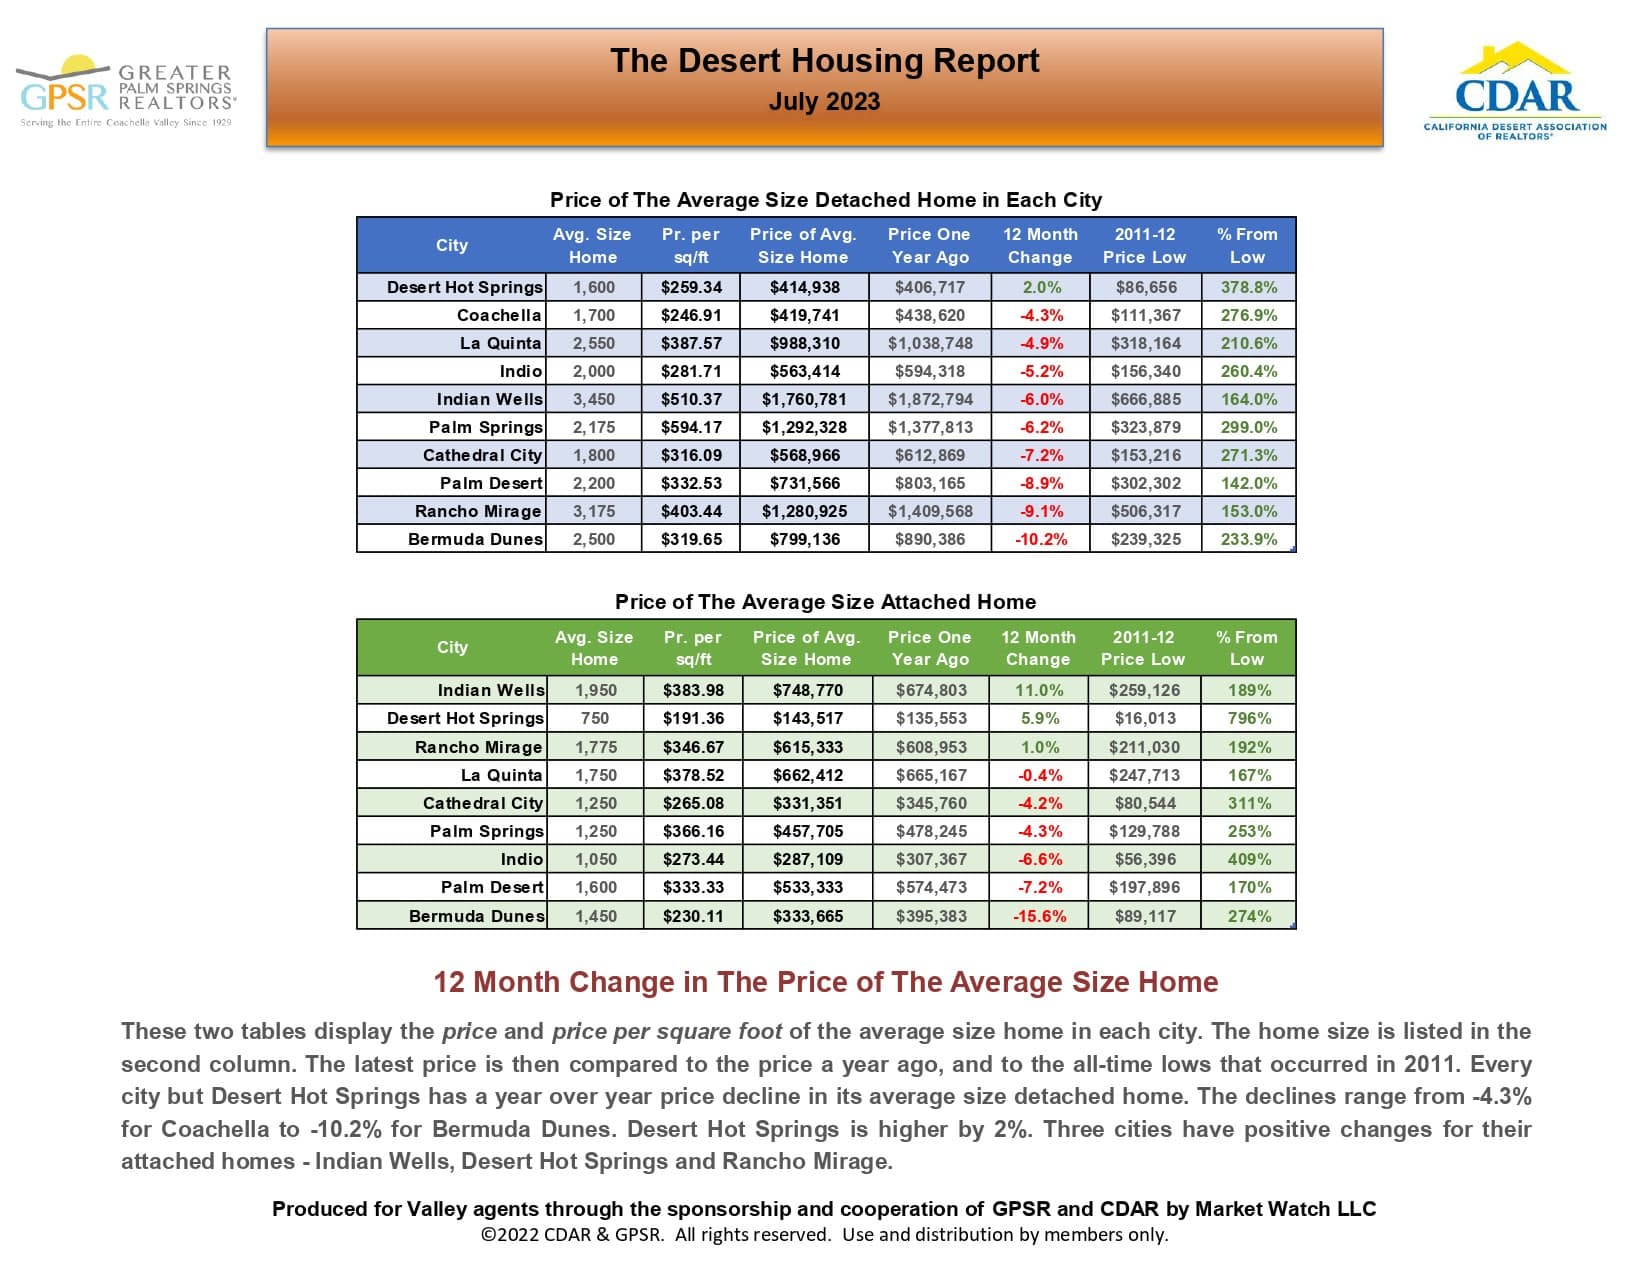
July 2023 Desert Housing Report tables compare average detached- and attached-home prices across desert cities.
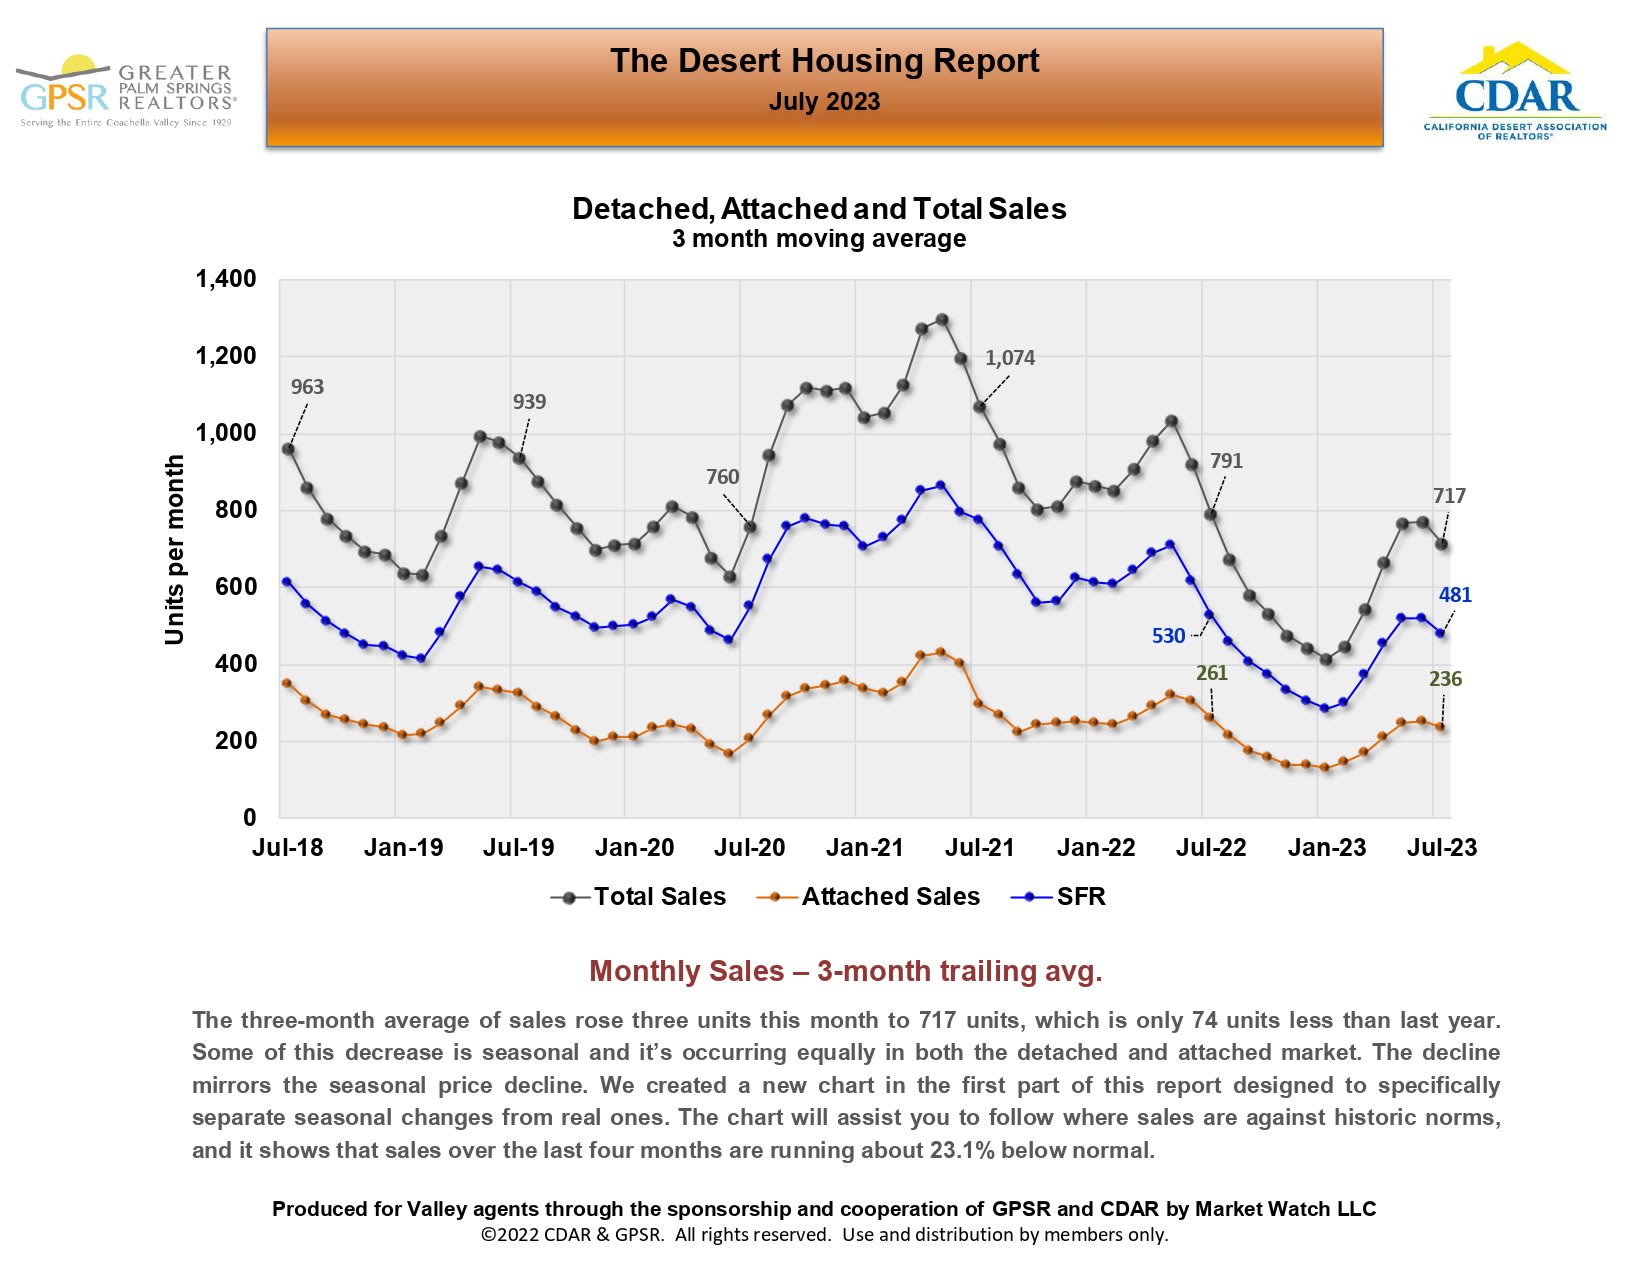
July 2023 Desert Housing Report chart of detached, attached, and total sales, 2018–2023.
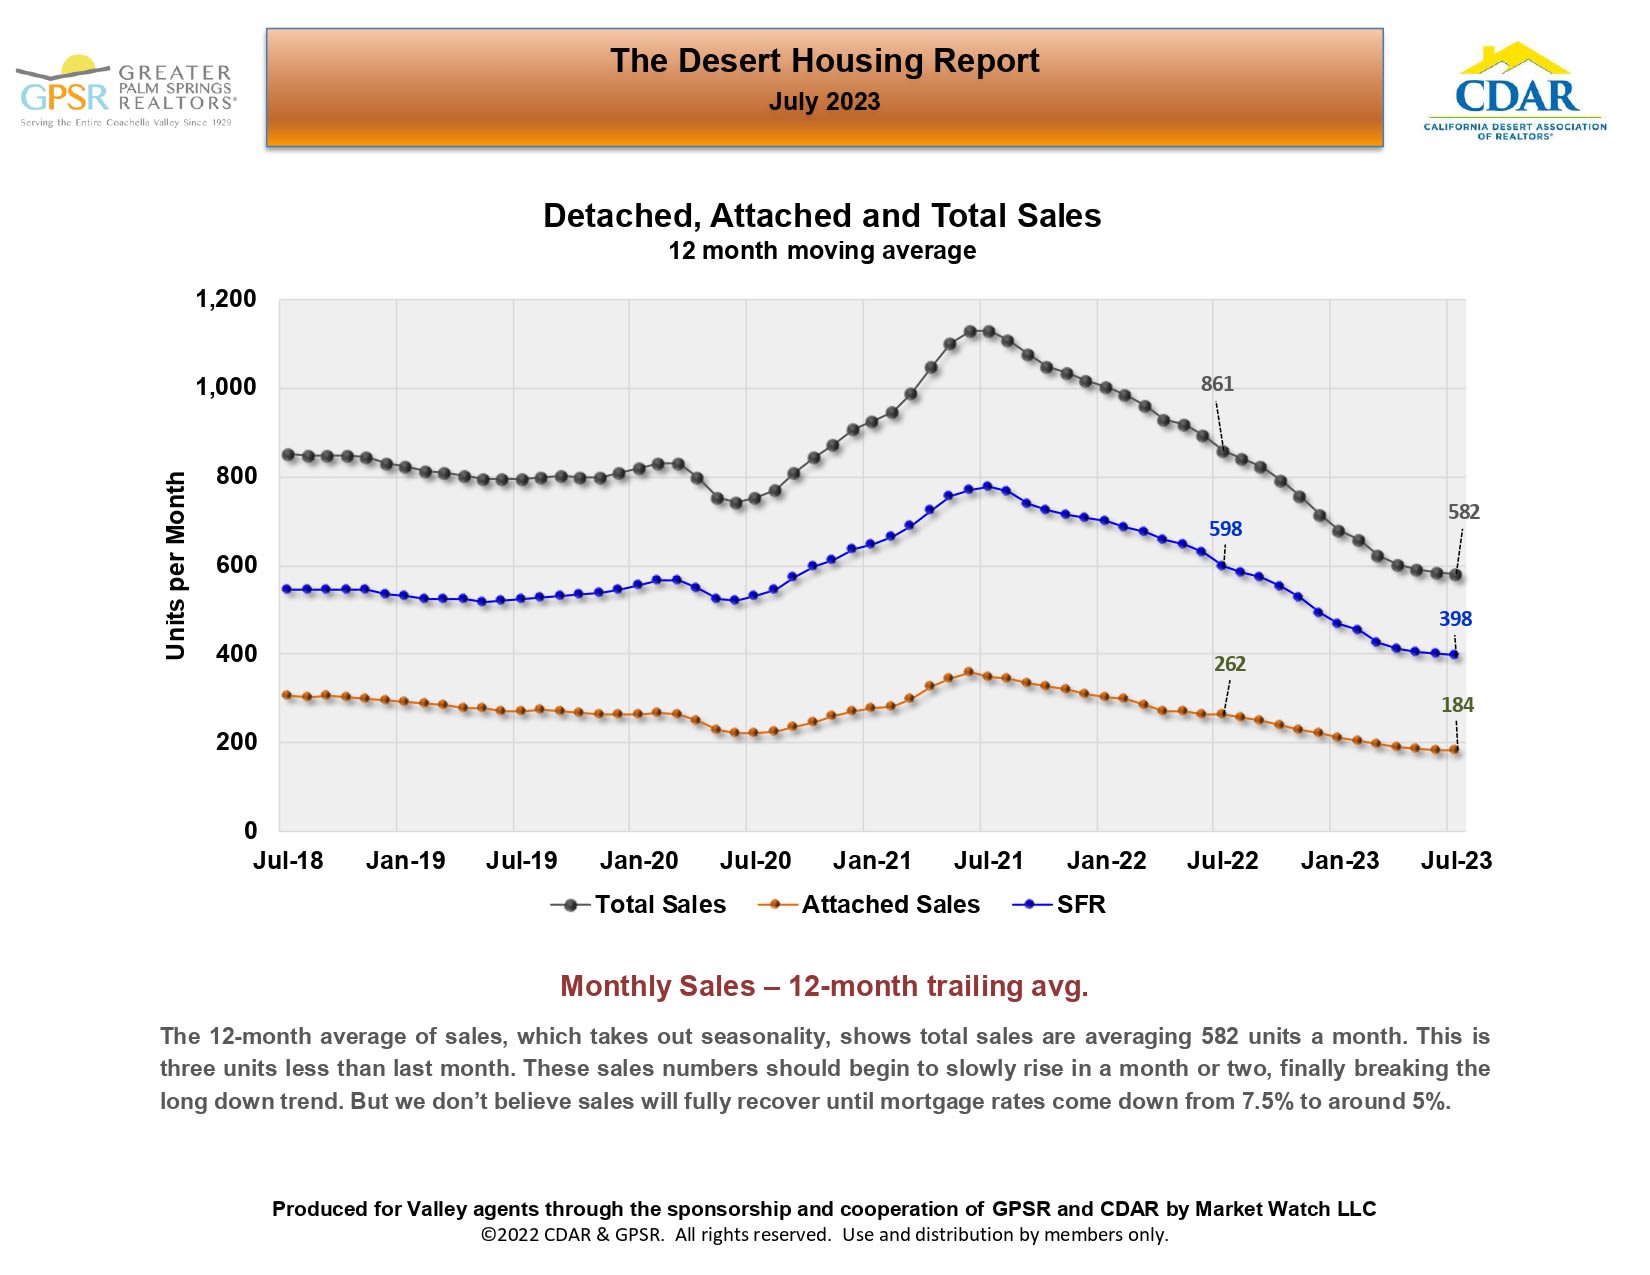
July 2023 Desert Housing Report chart showing monthly sales averages, ending at 582 total, 398 SFR, and 184 attached.
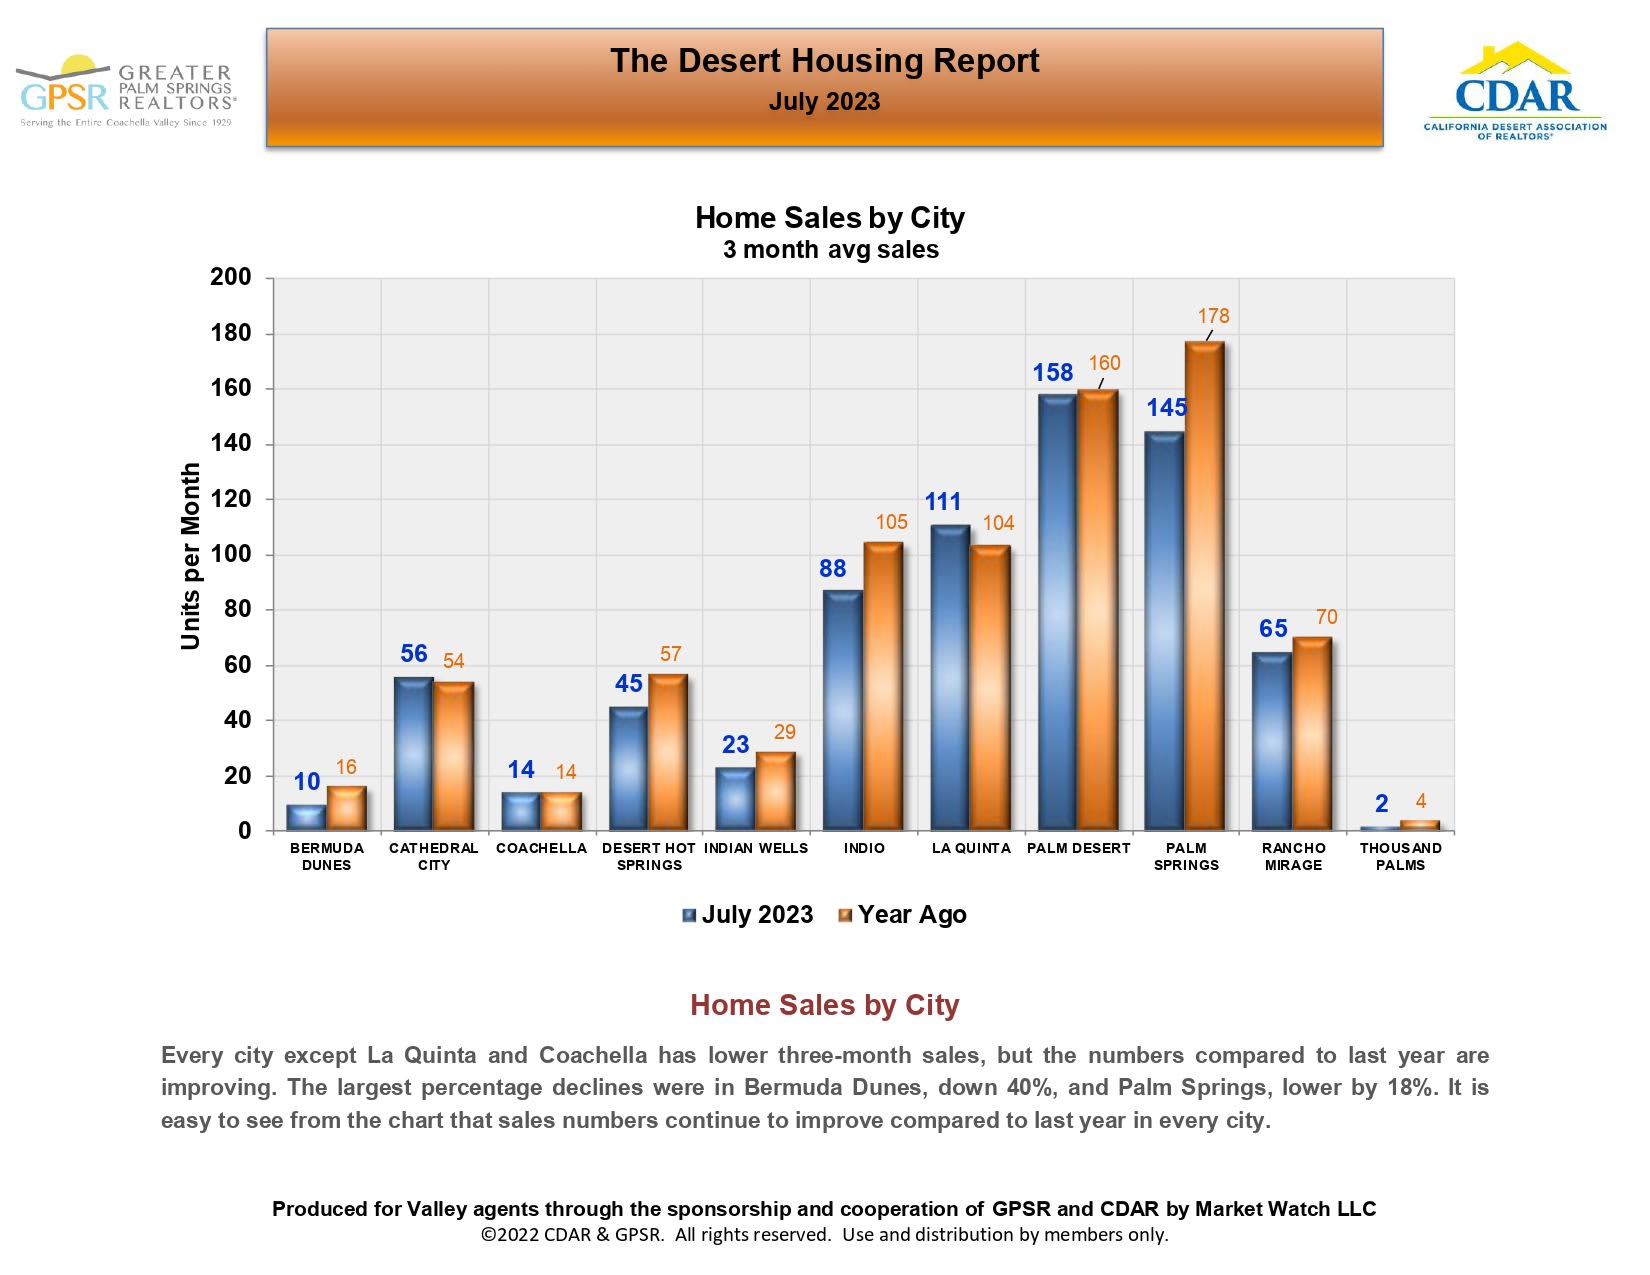
July 2023 chart comparing three-month average home sales across 11 Coachella Valley cities with the prior year.
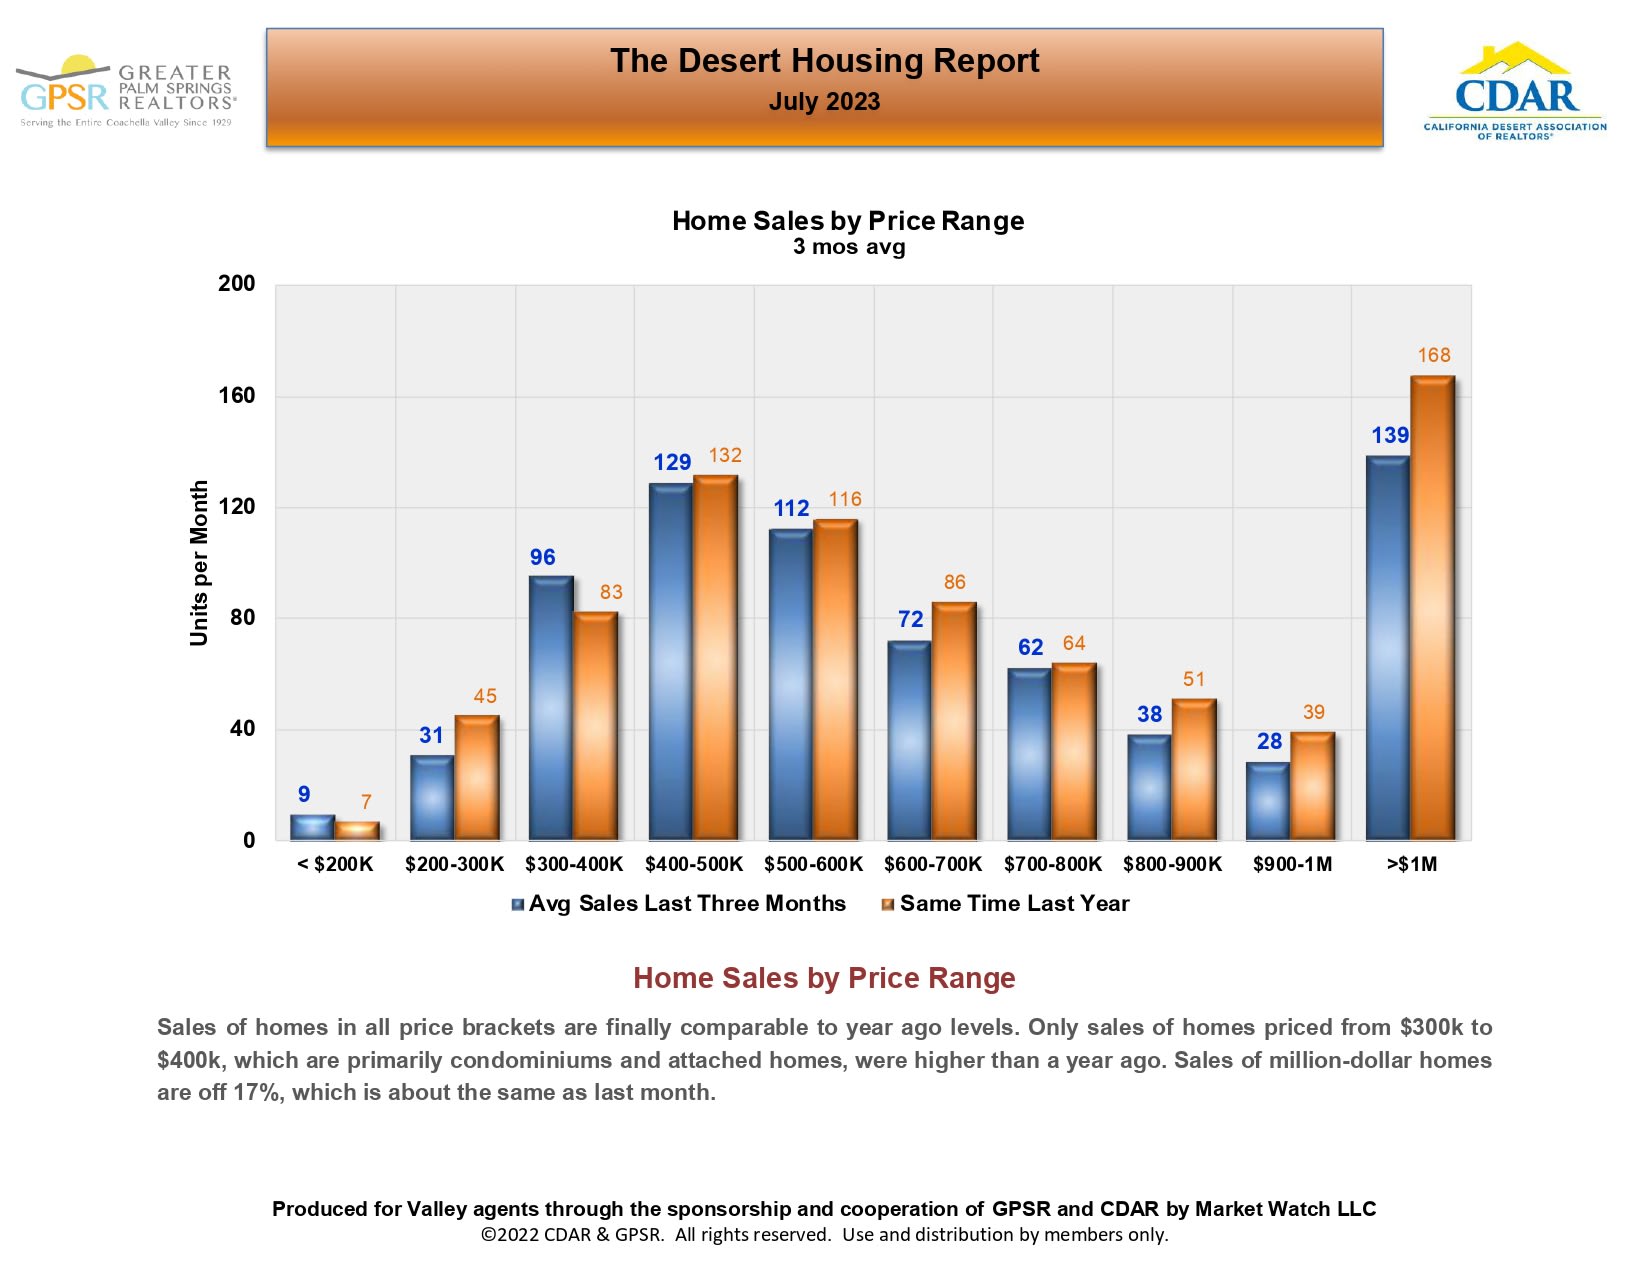
Bar chart comparing recent average home sales with last year across ten price ranges in the July 2023 Desert Housing Report.
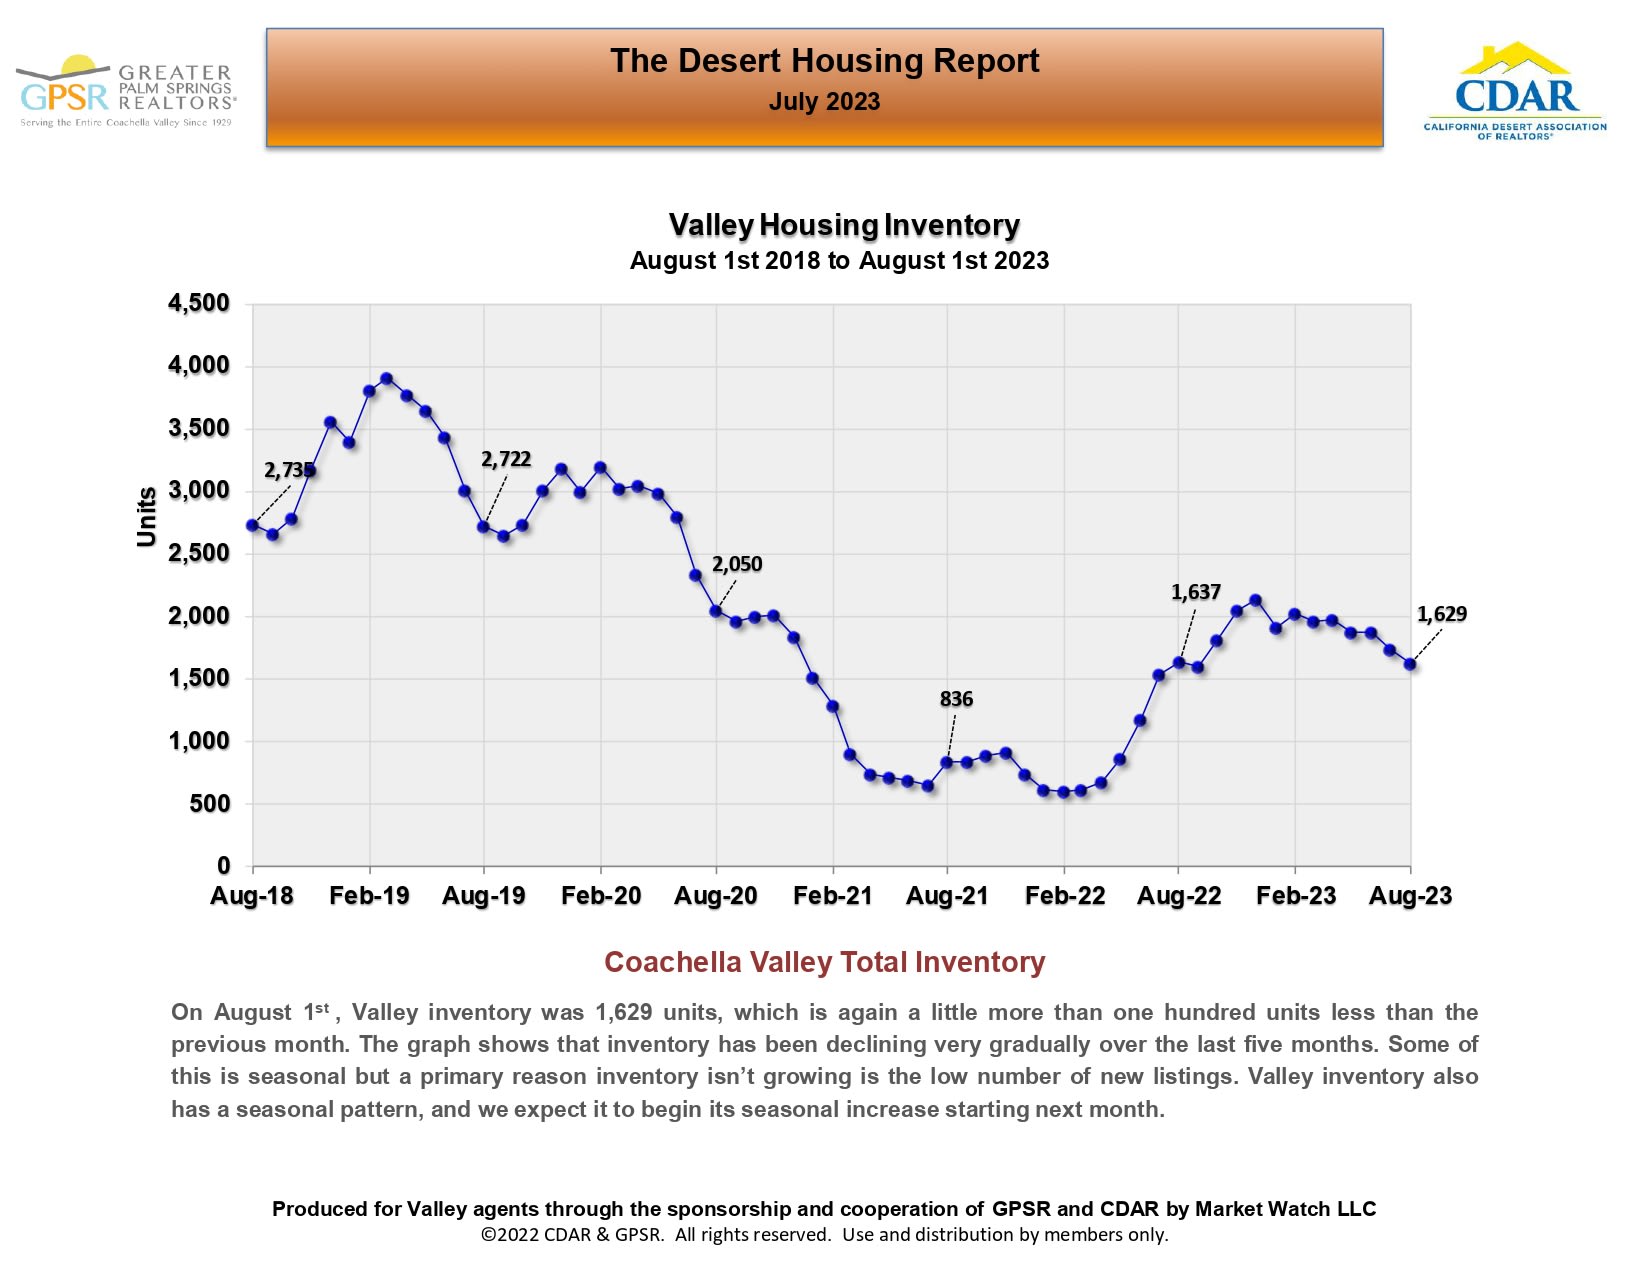
Chart of Coachella Valley housing inventory from 2018 to 2023, ending at 1,629 units in August 2023.
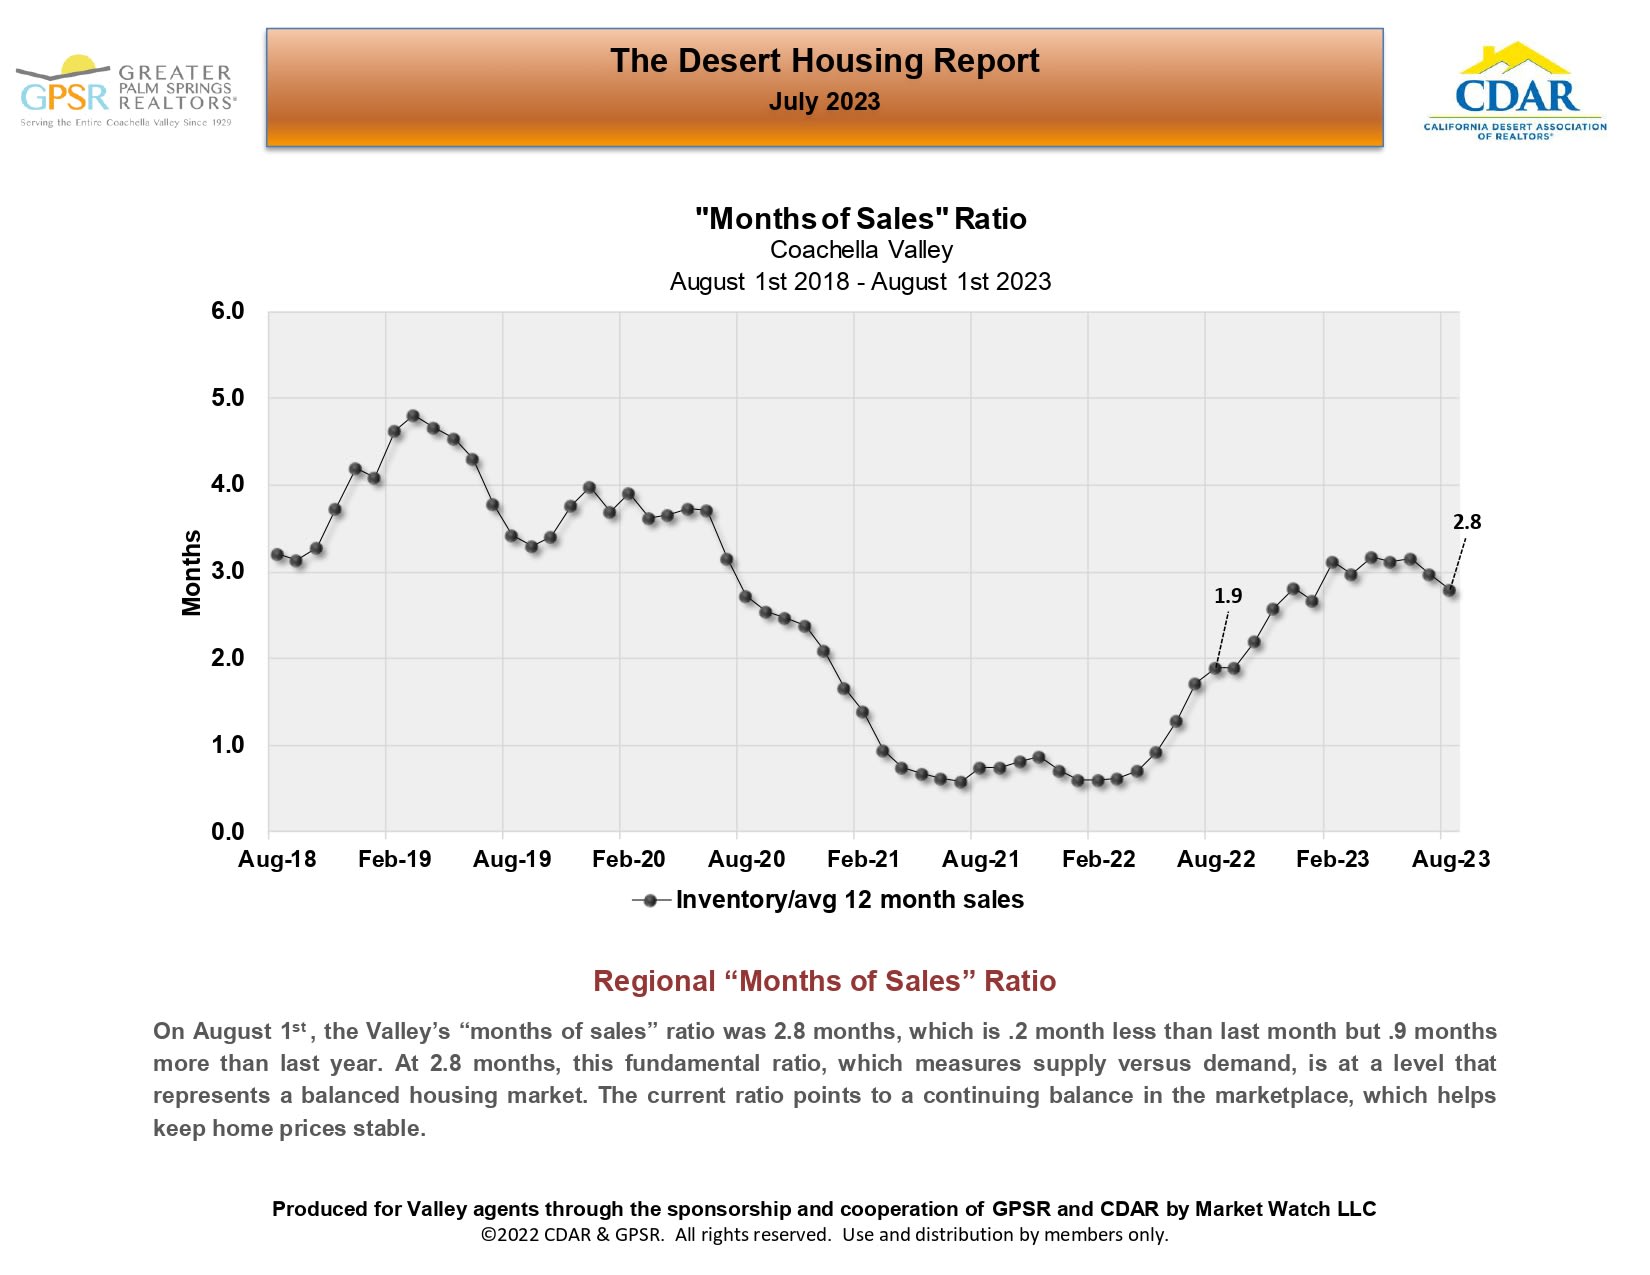
Coachella Valley months-of-sales chart, ending at 2.8 months in August 2023 after a rise from 2022 lows.
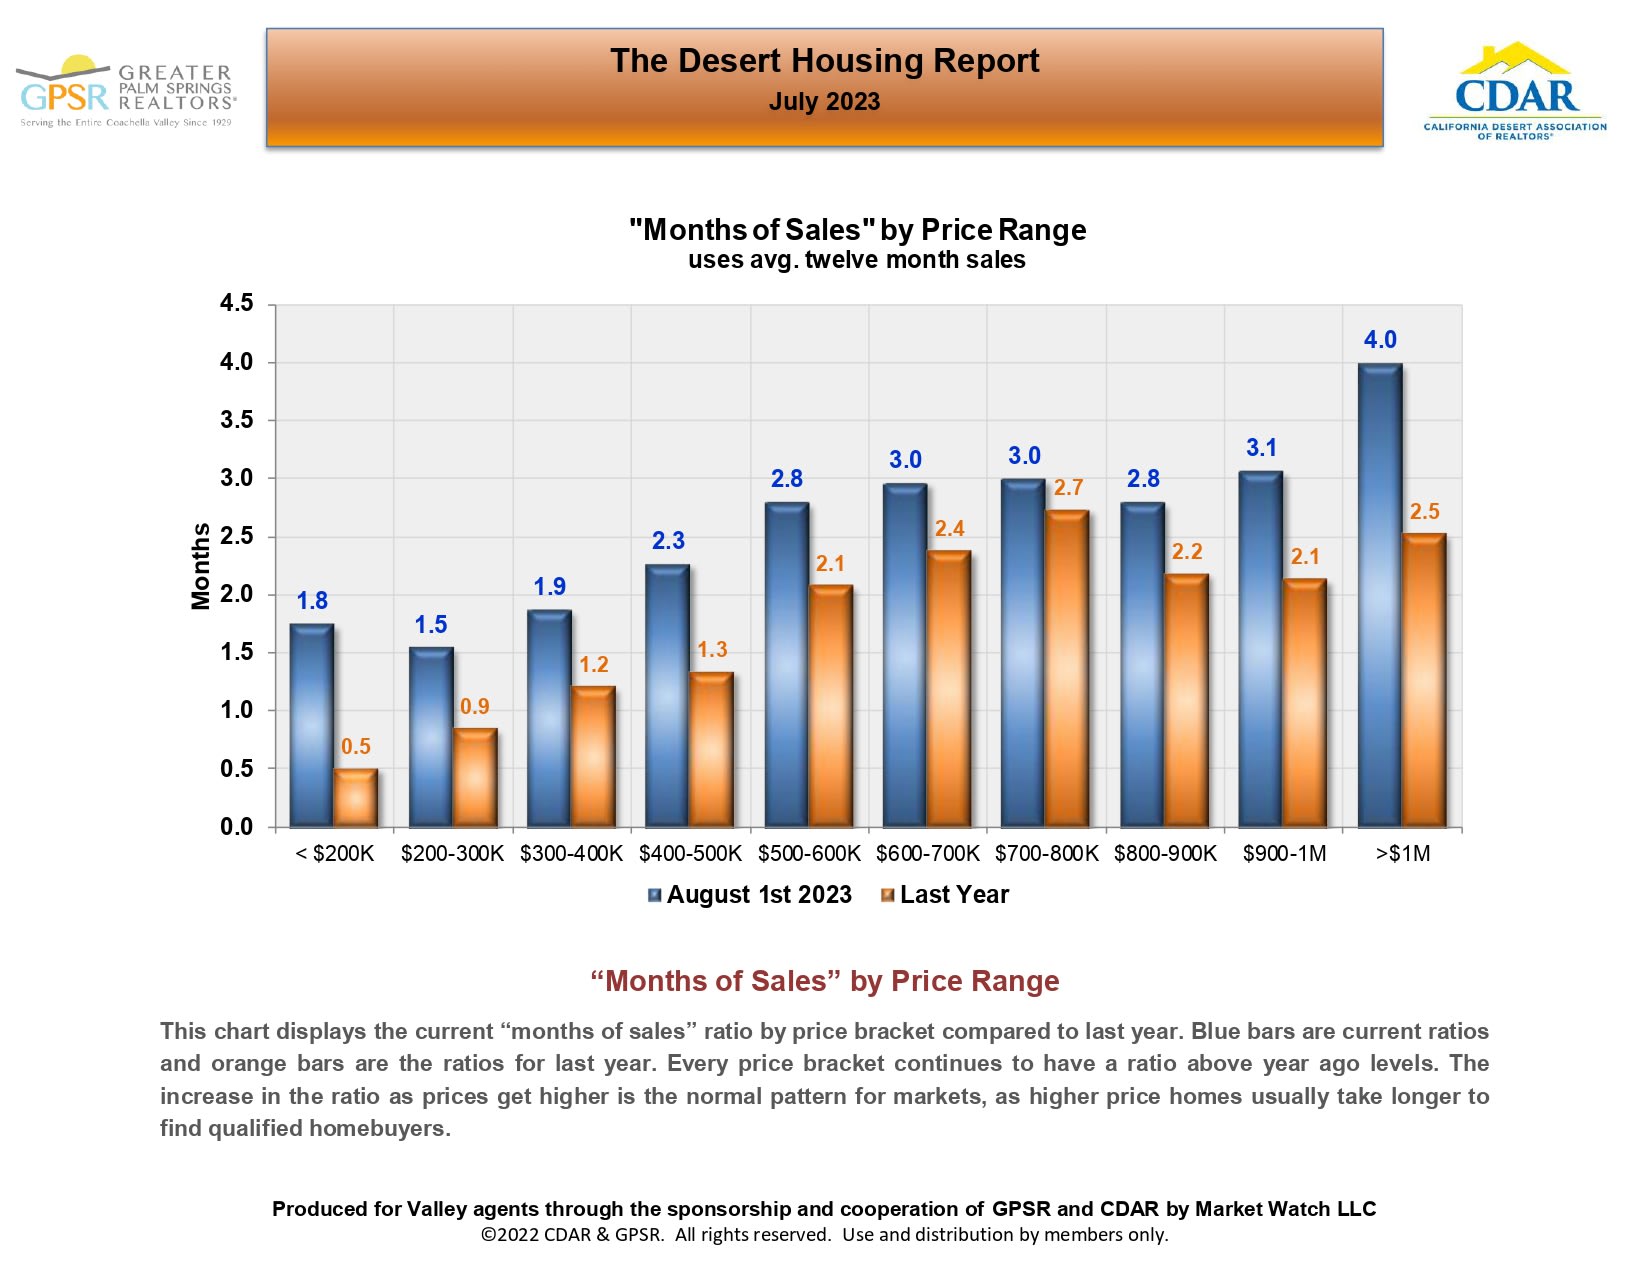
Chart compares months of home sales by price range in August 2023 and last year; current ratios are higher across all brackets.
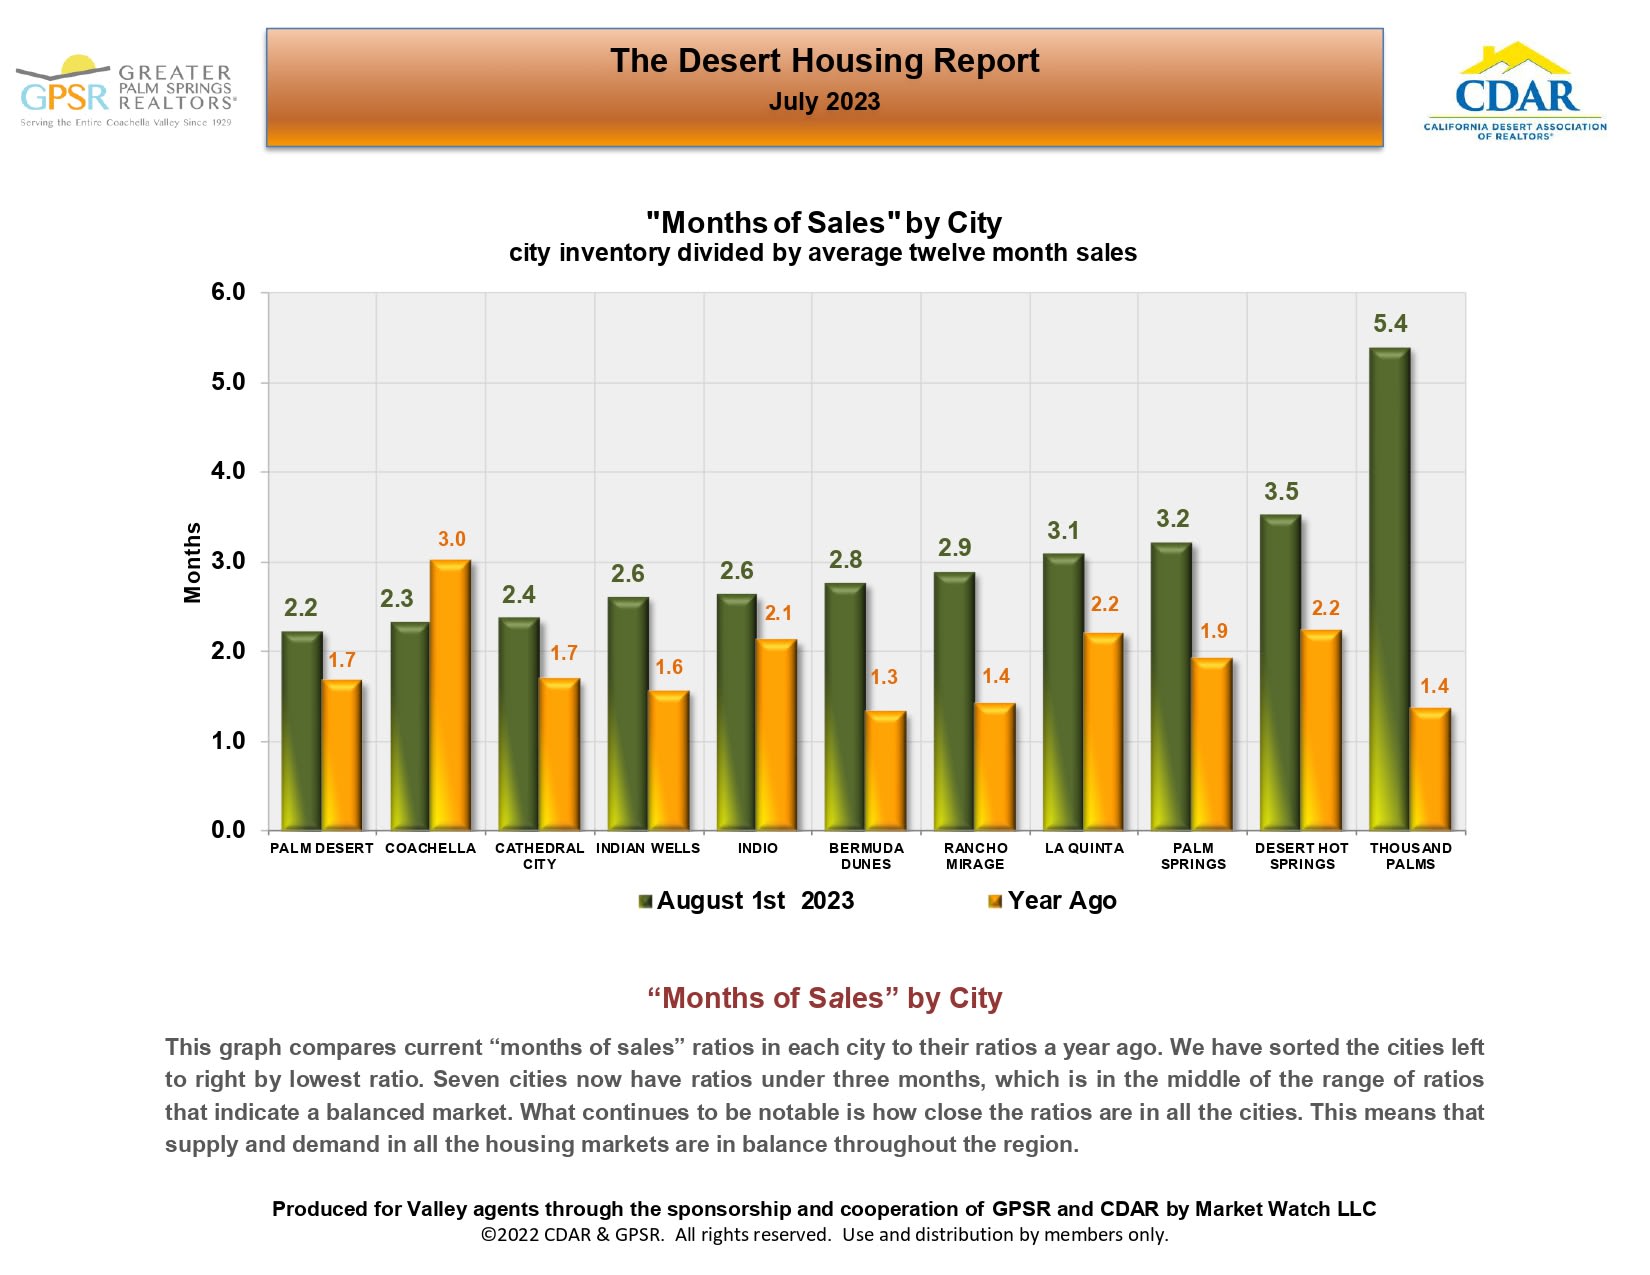
Chart comparing current and year-ago months of home sales inventory across 11 Coachella Valley cities.
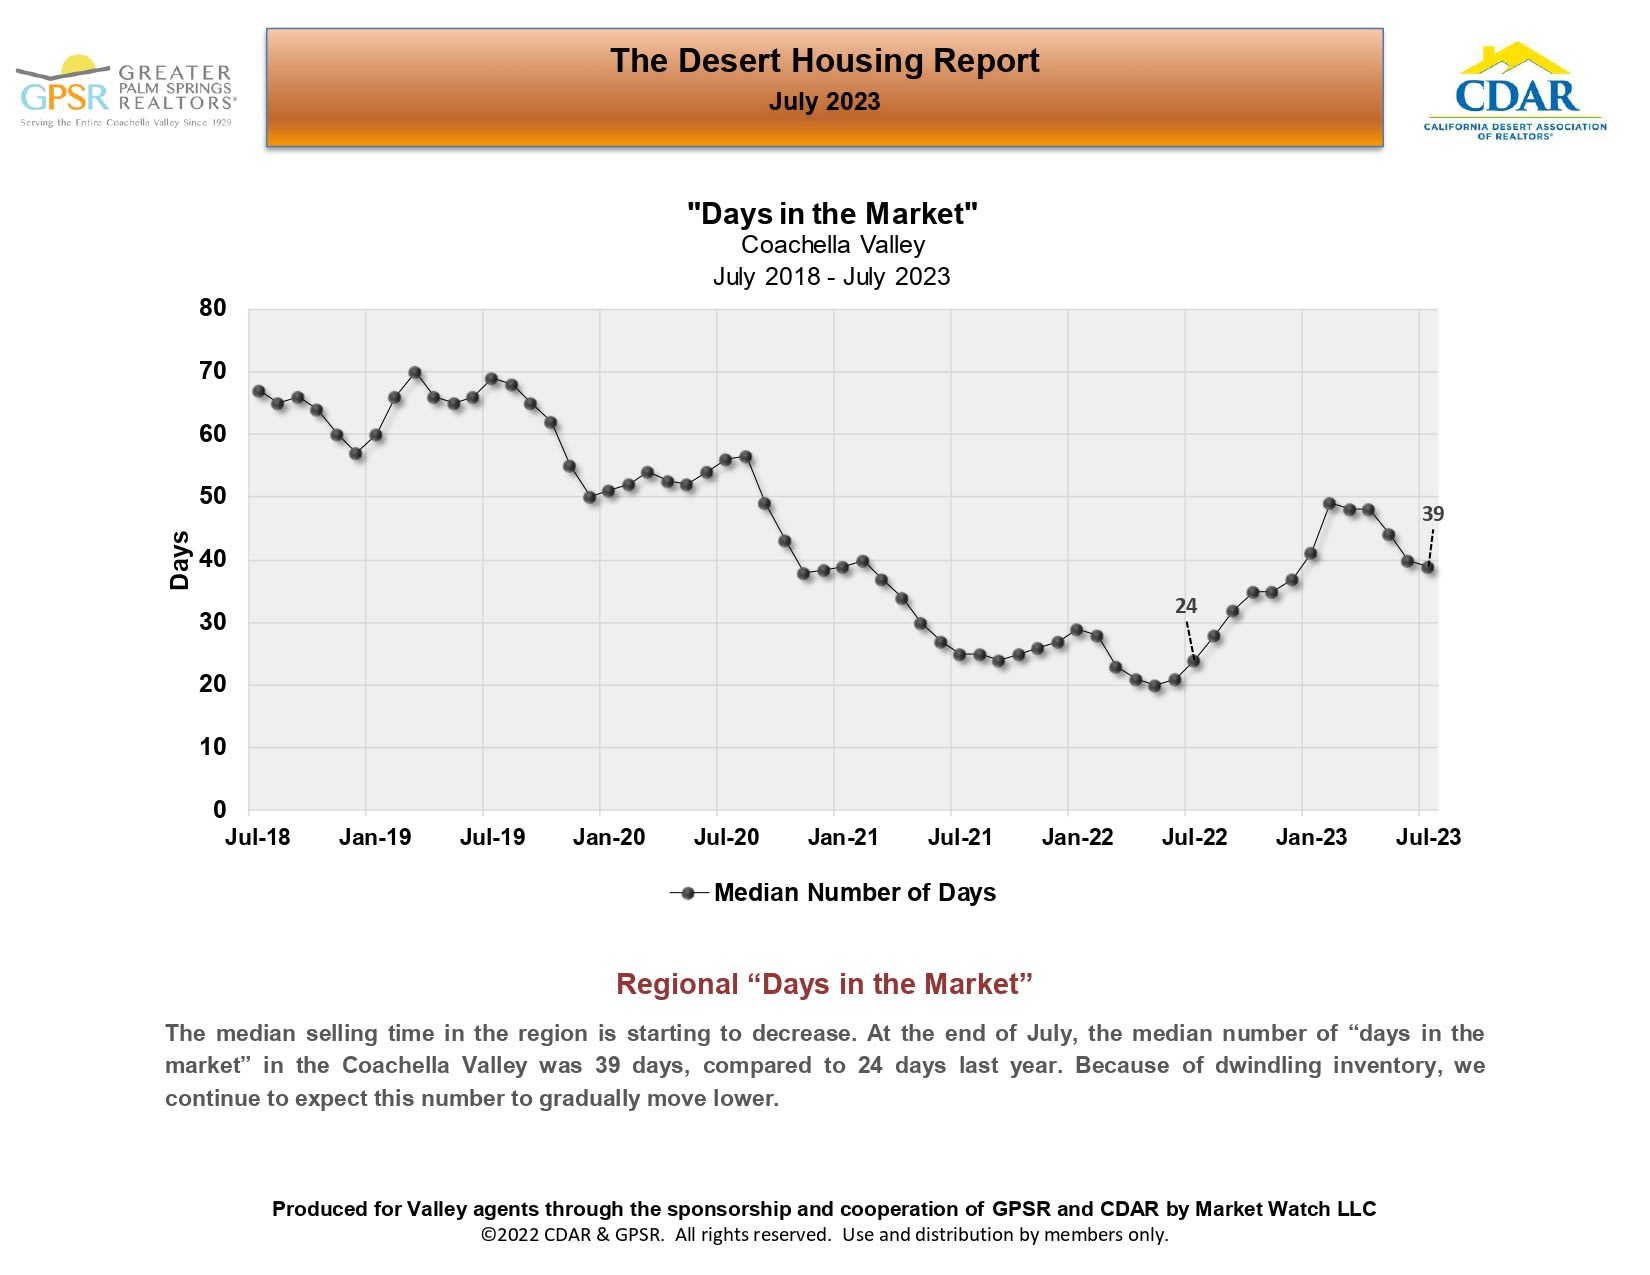
Coachella Valley median days-in-market chart, July 2018–July 2023, ending at 39 days.
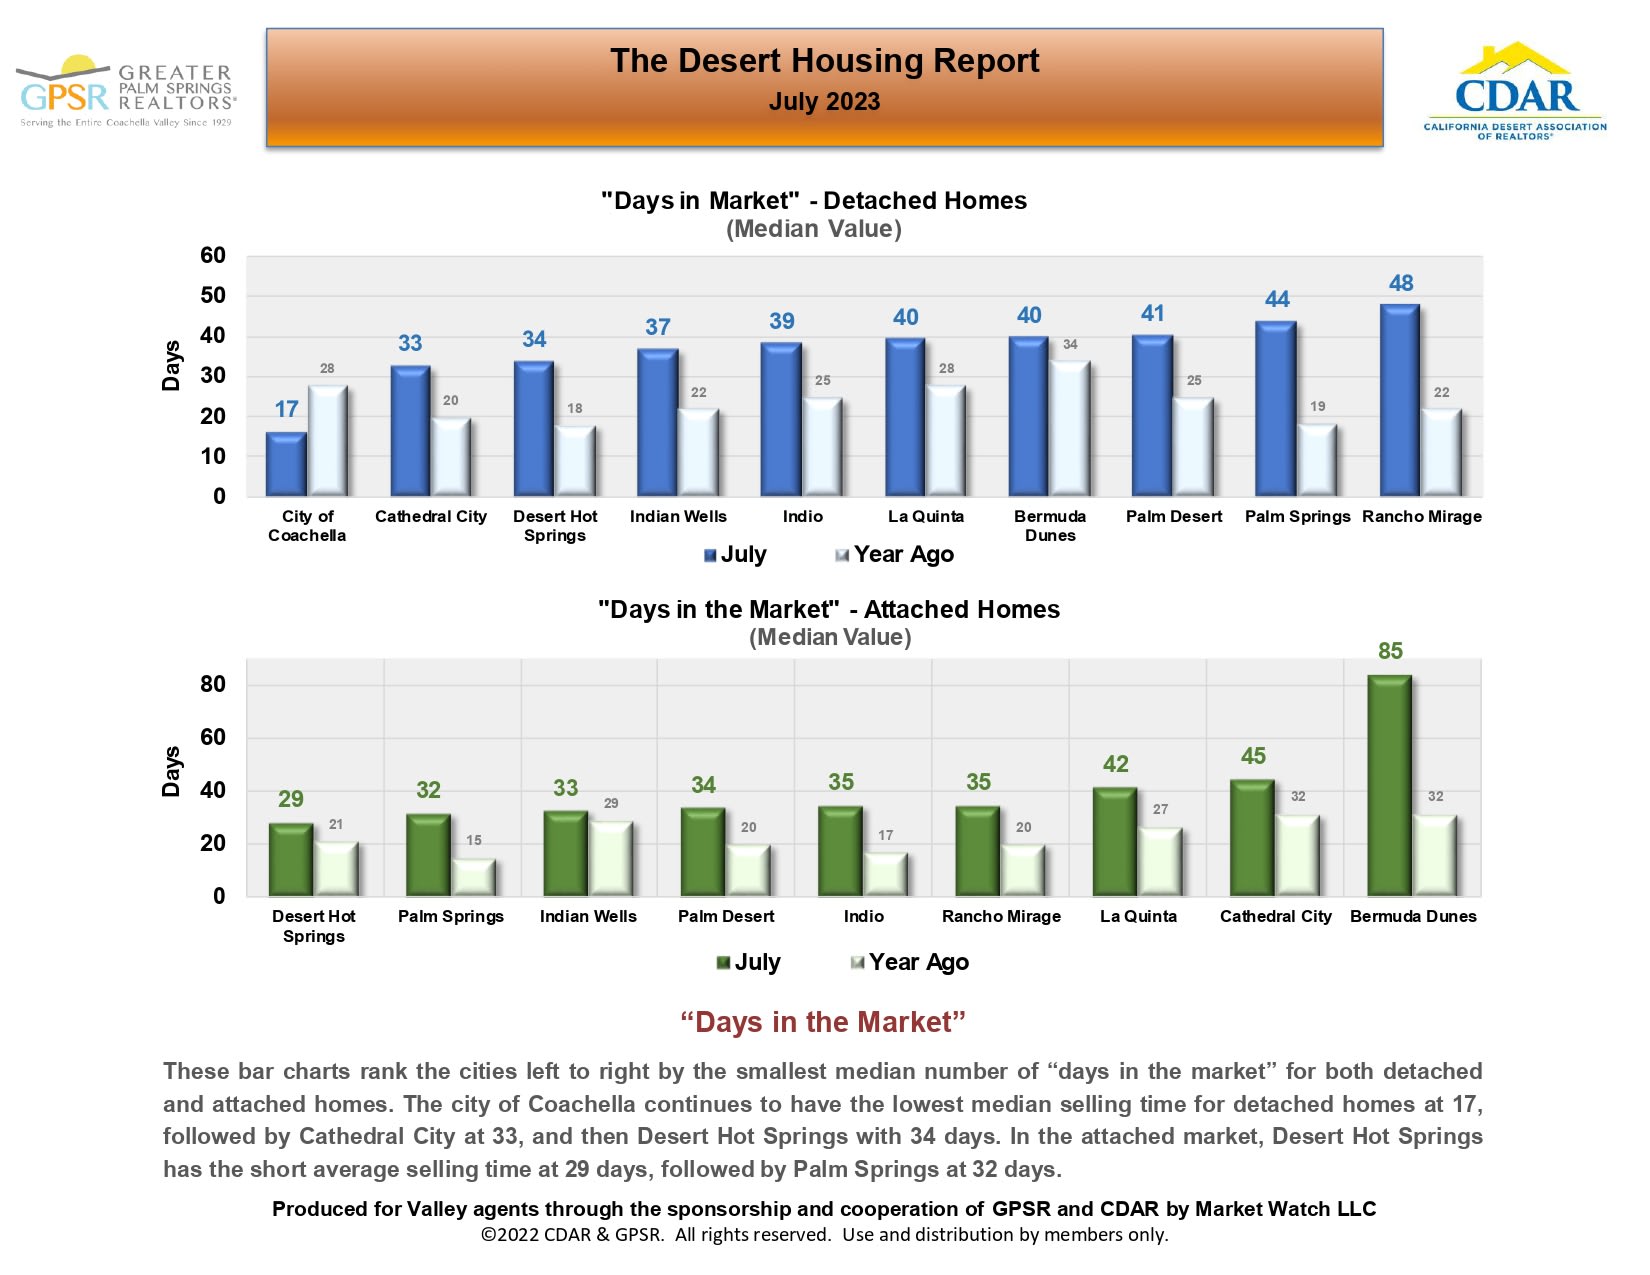
July 2023 Desert Housing Report charts comparing median days on market for detached and attached homes in Coachella Valley cities.
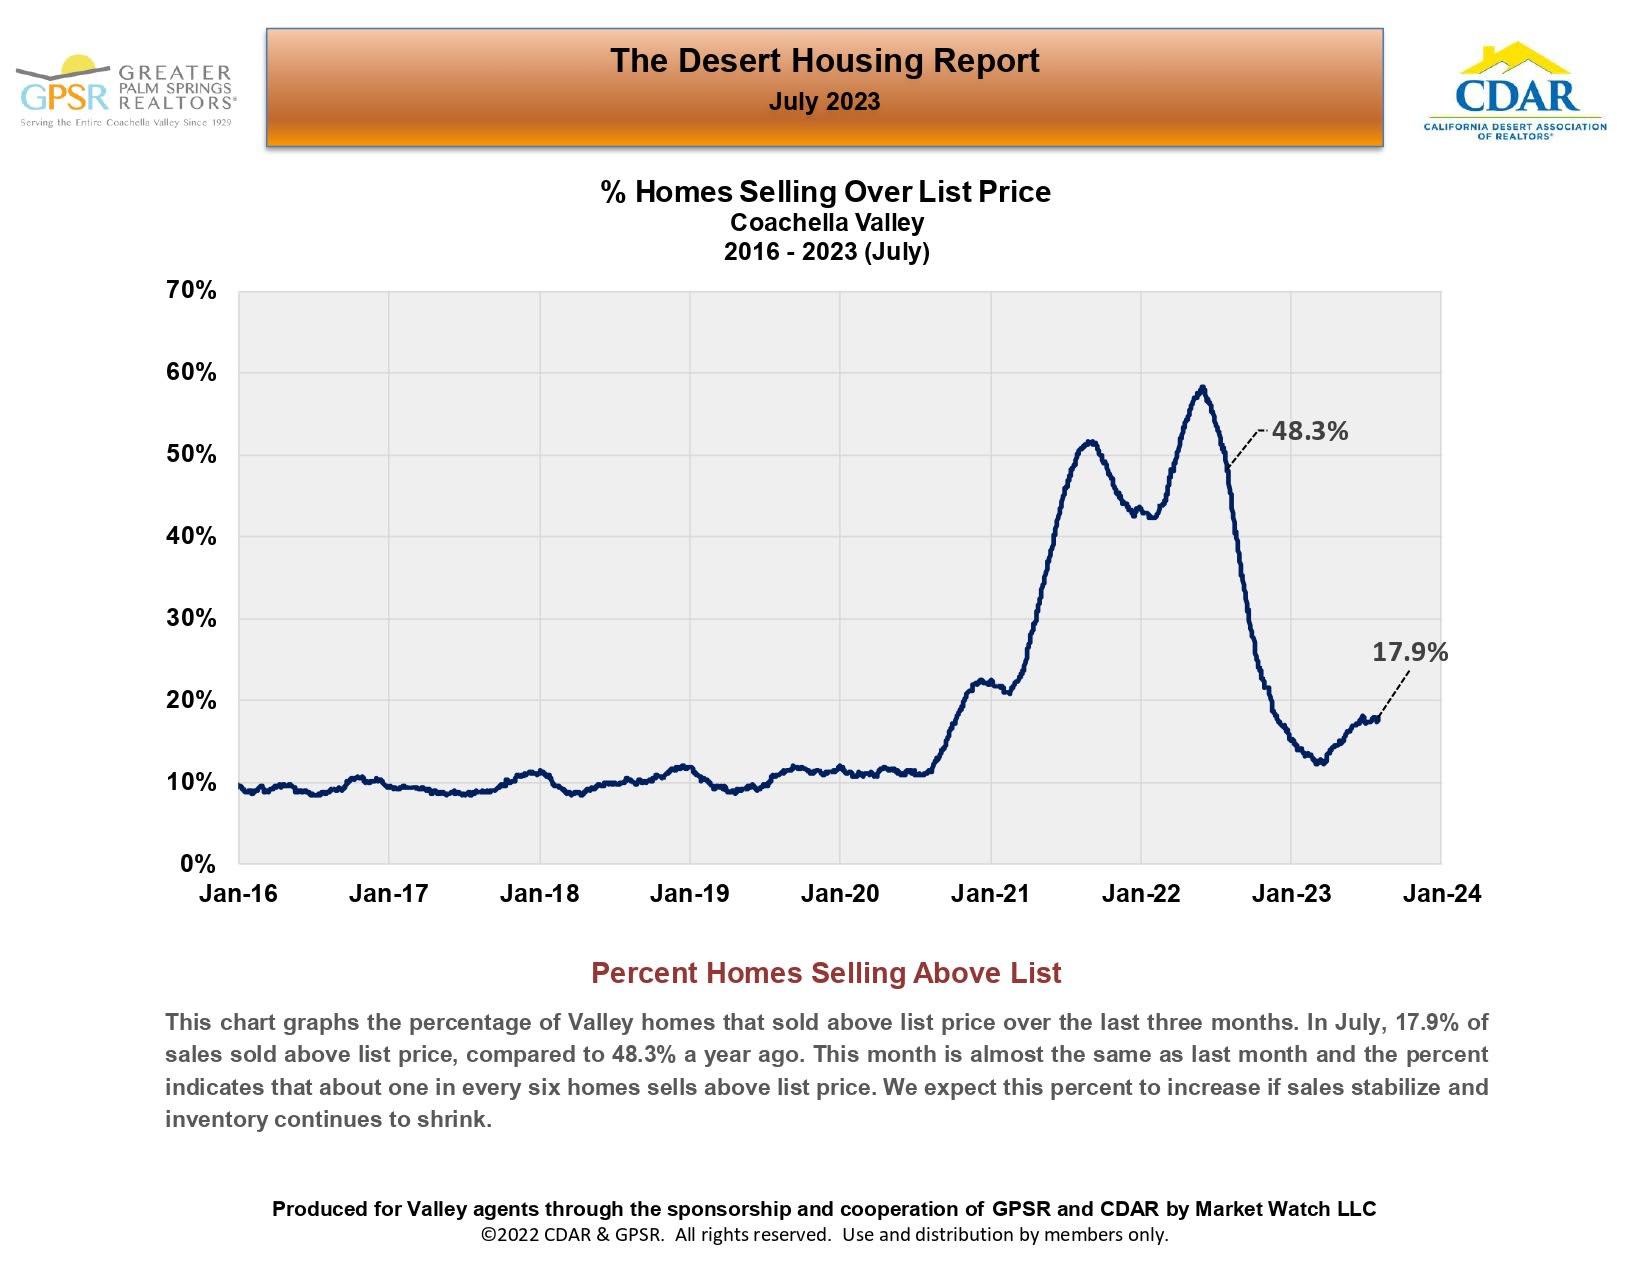
Chart of Coachella Valley homes selling above list price, showing 17.9% in July 2023 versus 48.3% a year earlier.
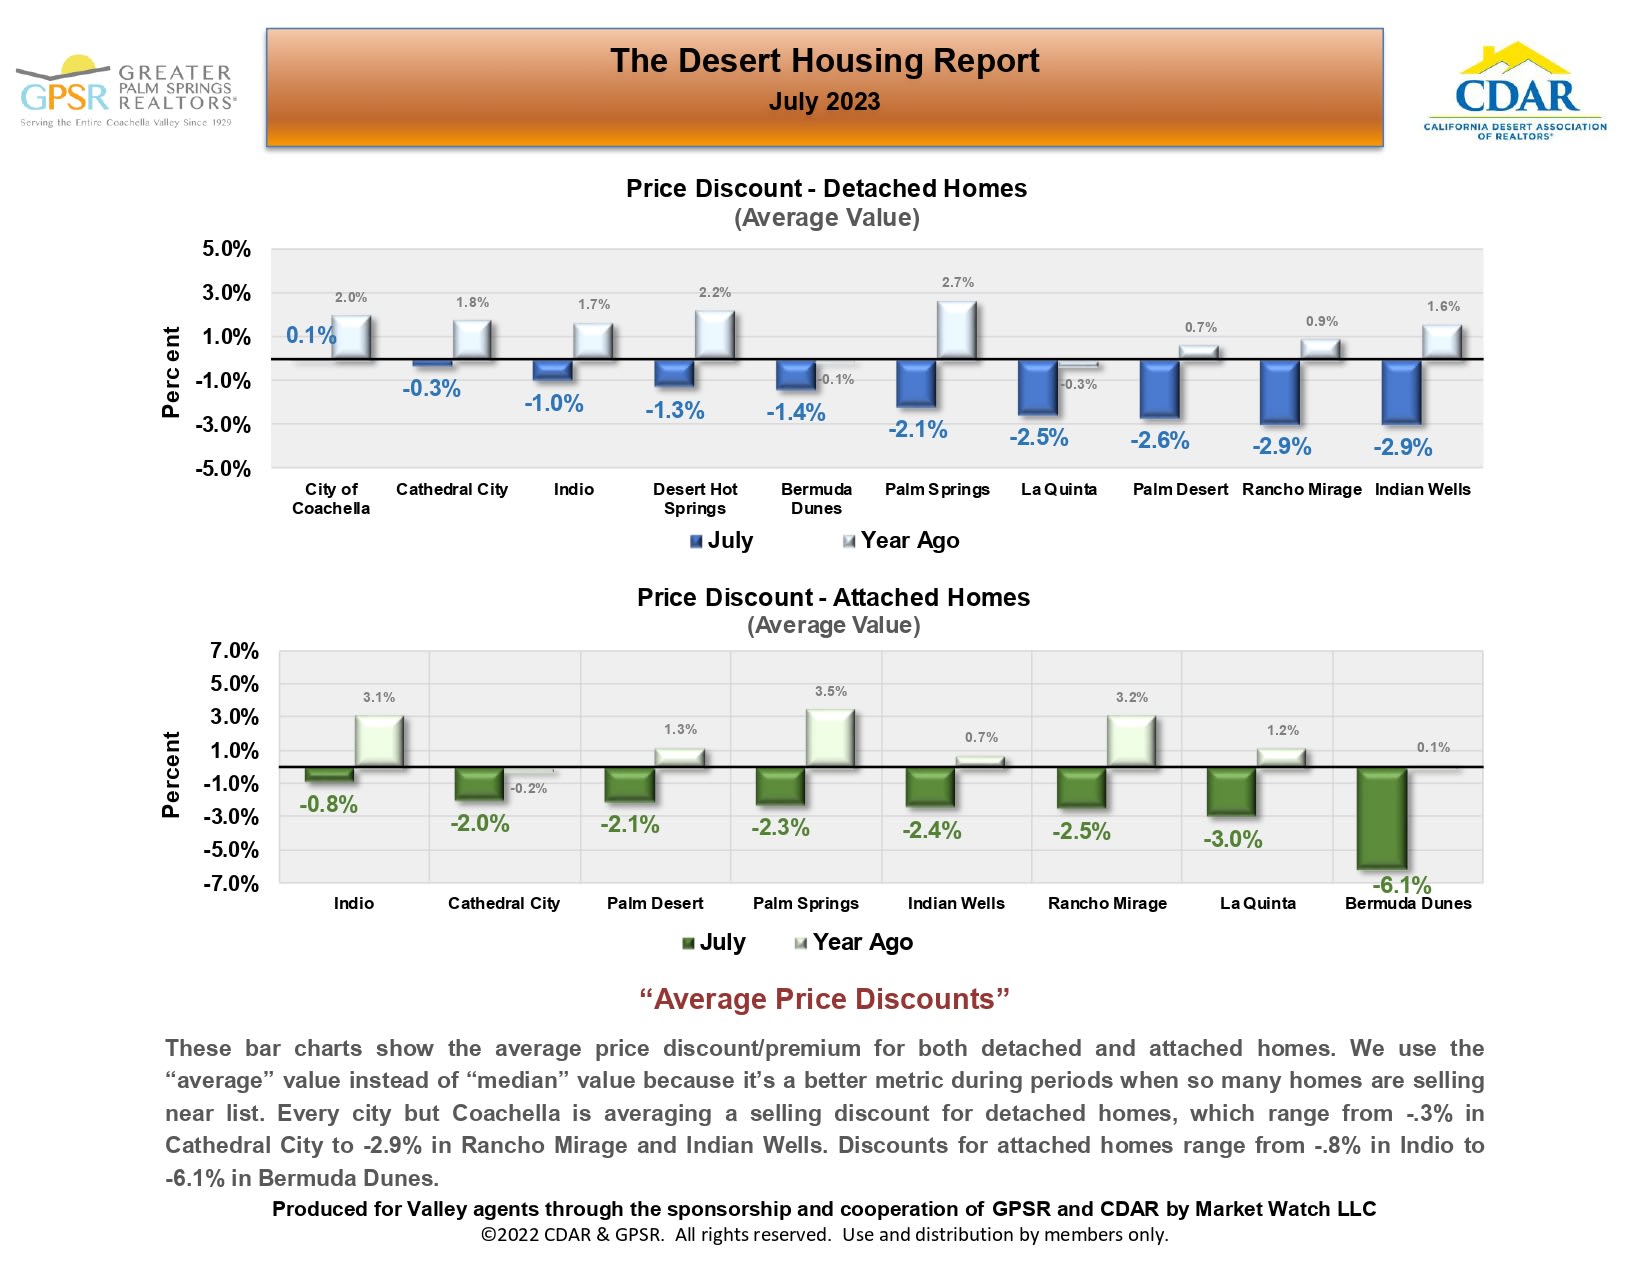
July 2023 Desert Housing Report charts comparing detached and attached home price discounts across Coachella Valley cities.
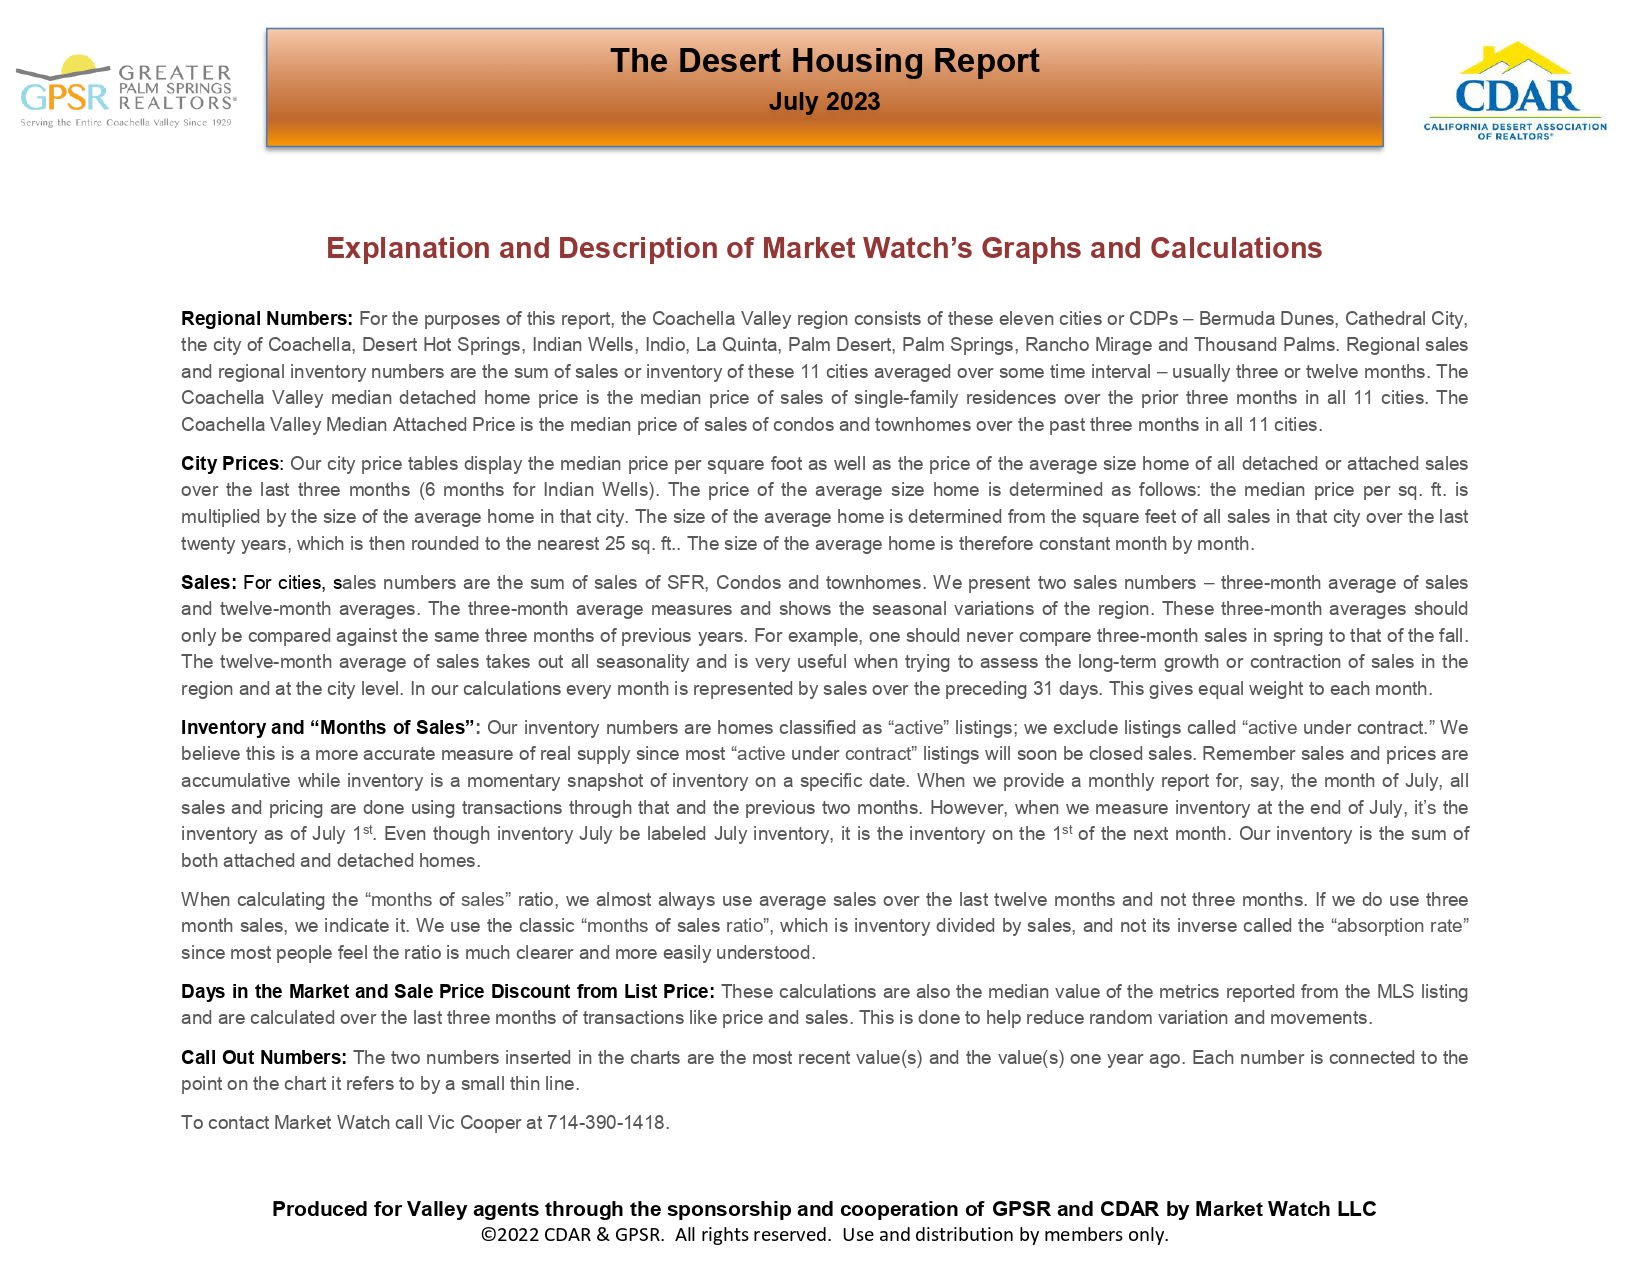
July 2023 Desert Housing Report page explaining Market Watch’s real estate graphs and calculations.

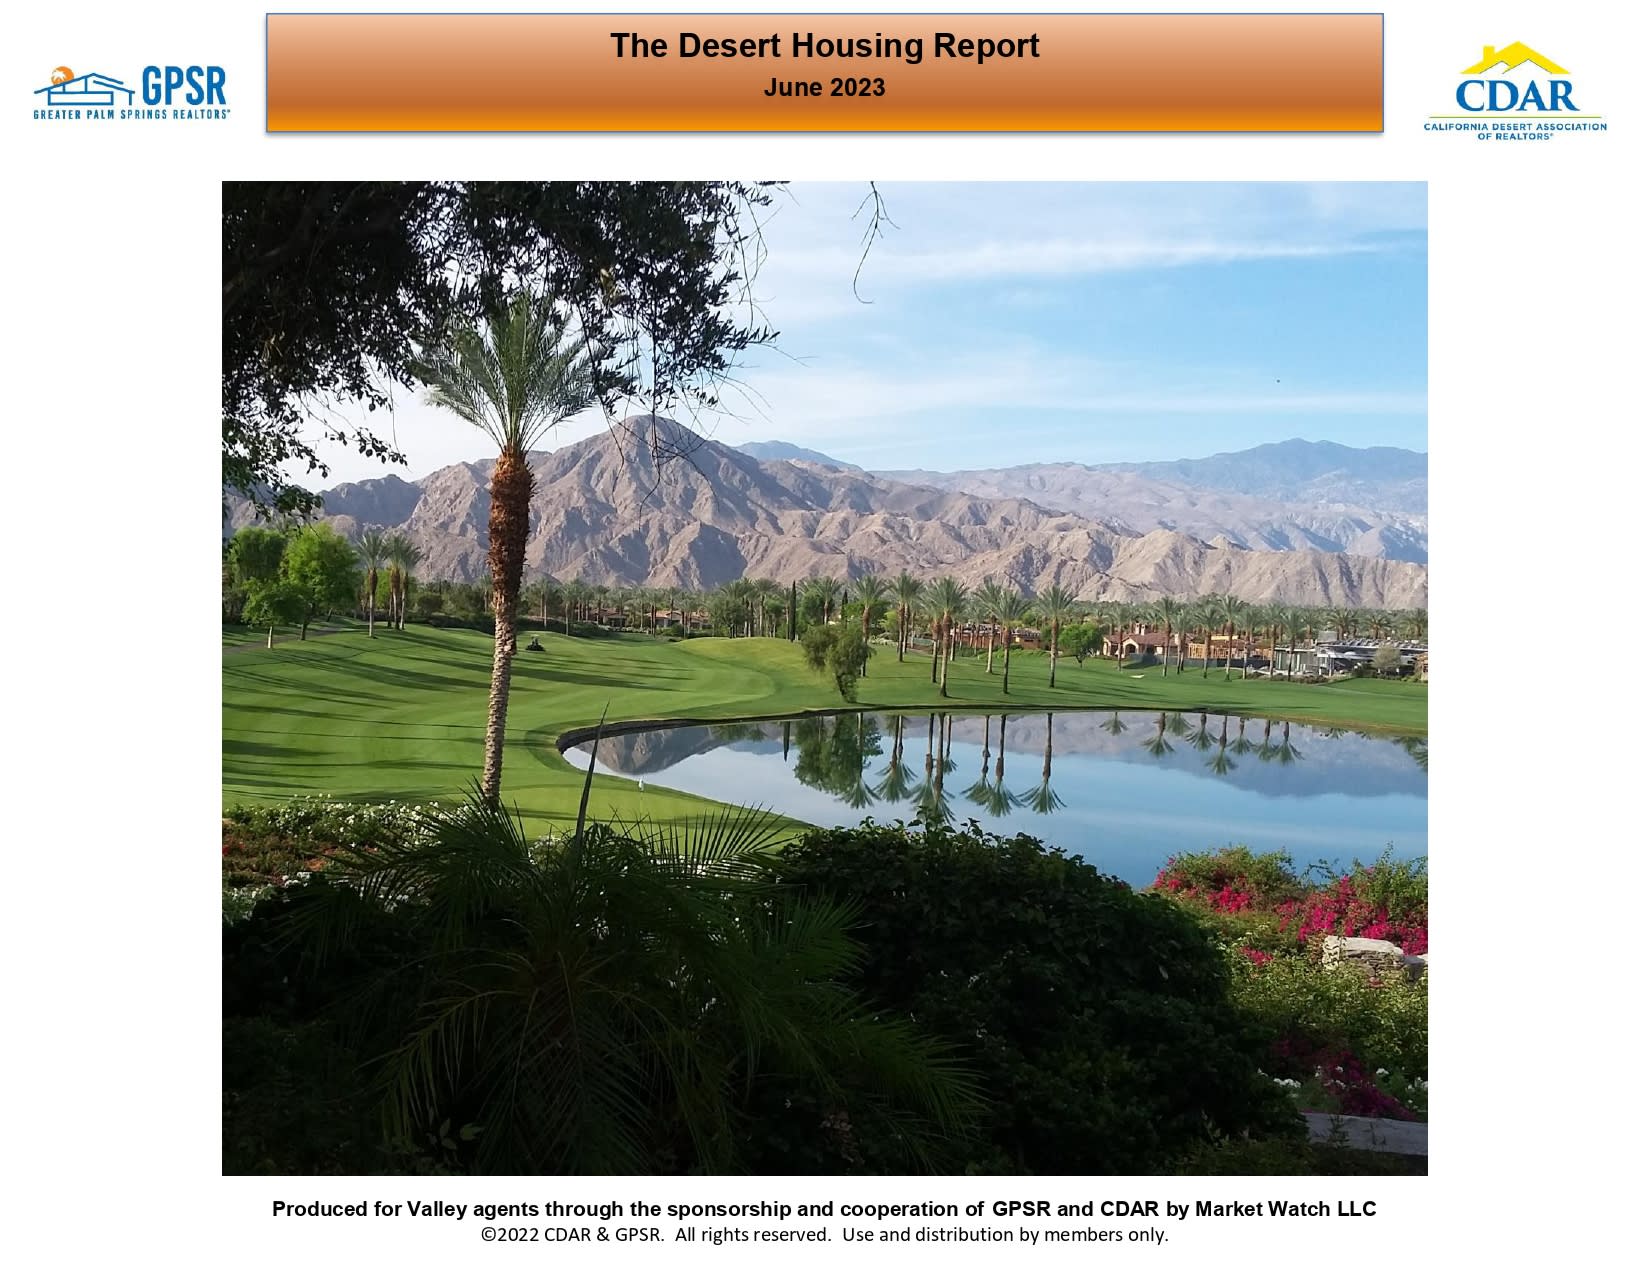
June 2023 Desert Housing Report cover with a palm-lined golf course, reflective pond, and desert mountains.

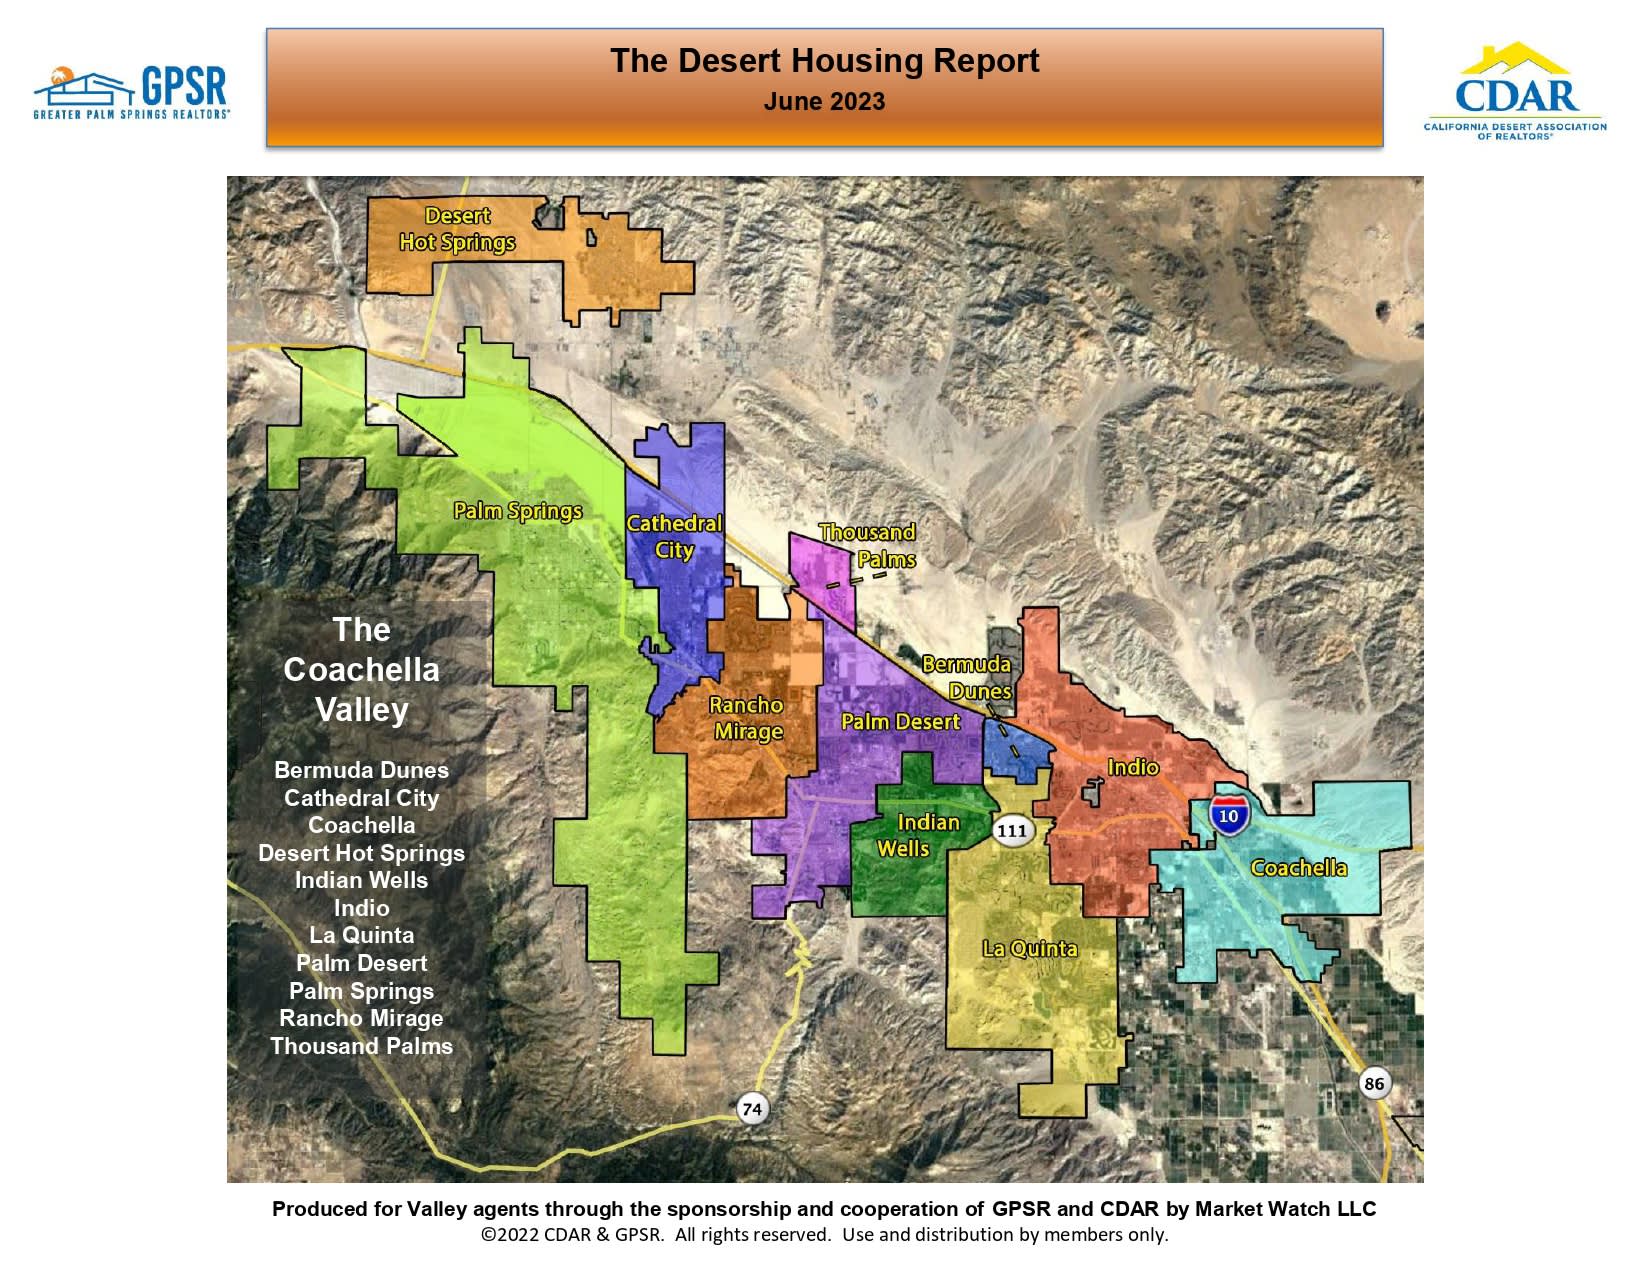
Color-coded map of Coachella Valley communities in the June 2023 Desert Housing Report.

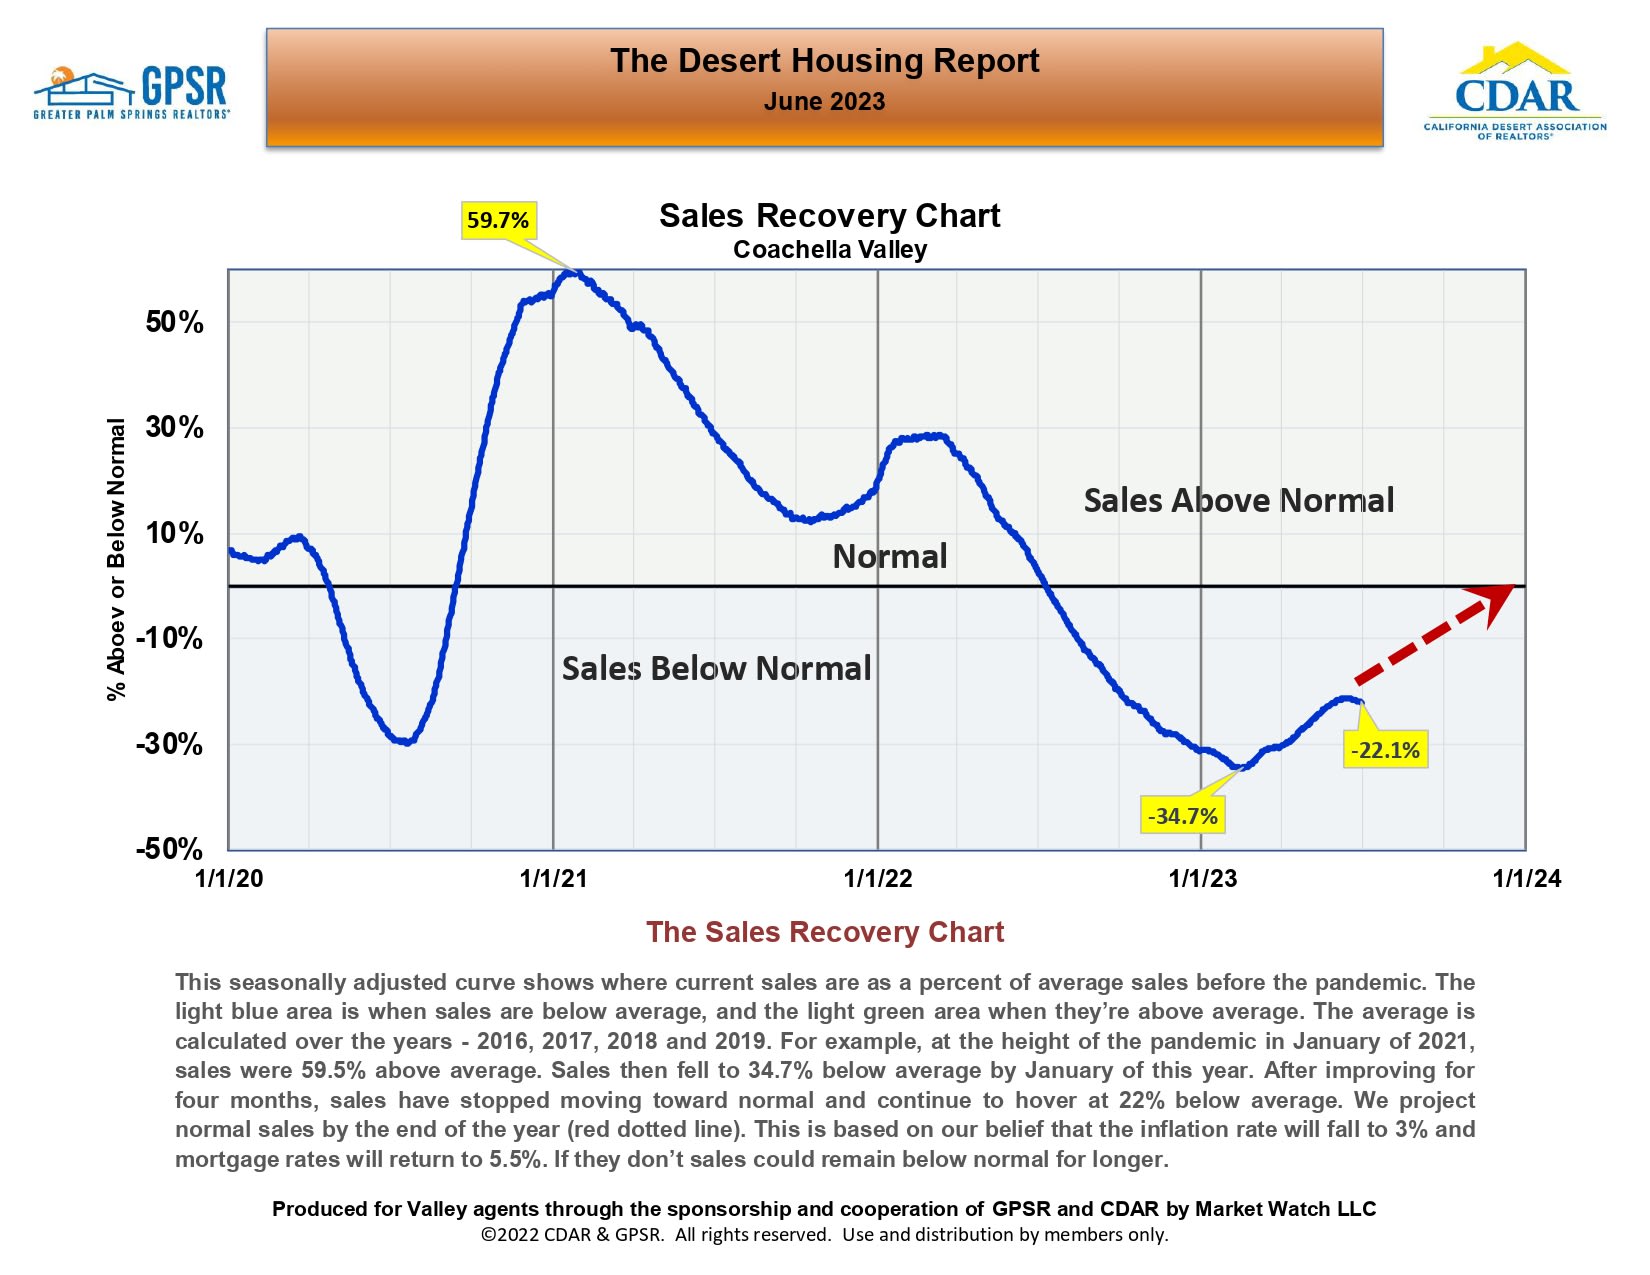
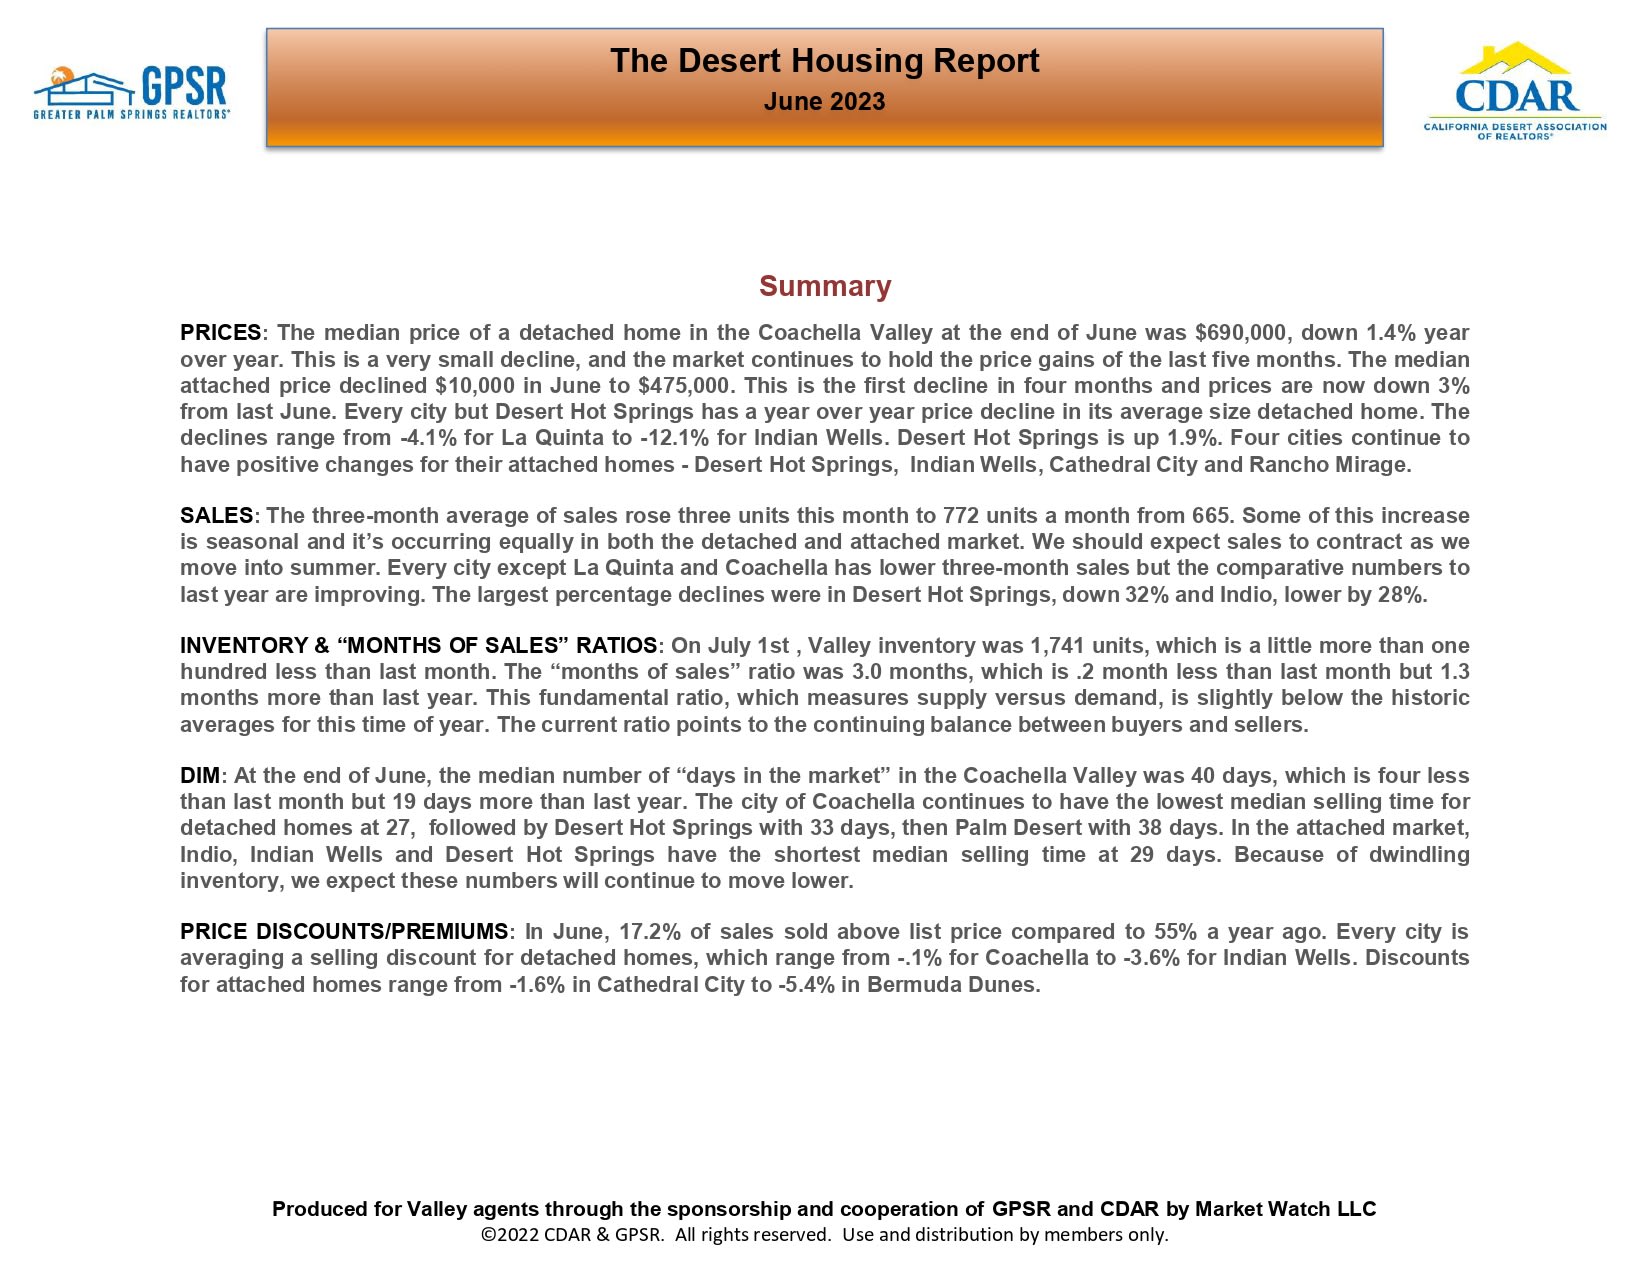
Coachella Valley sales recovery chart shows home sales 22.1% below normal in 2023, with a projected return to normal.June 2023 Desert Housing Report summarizing Coachella Valley real estate market trends.

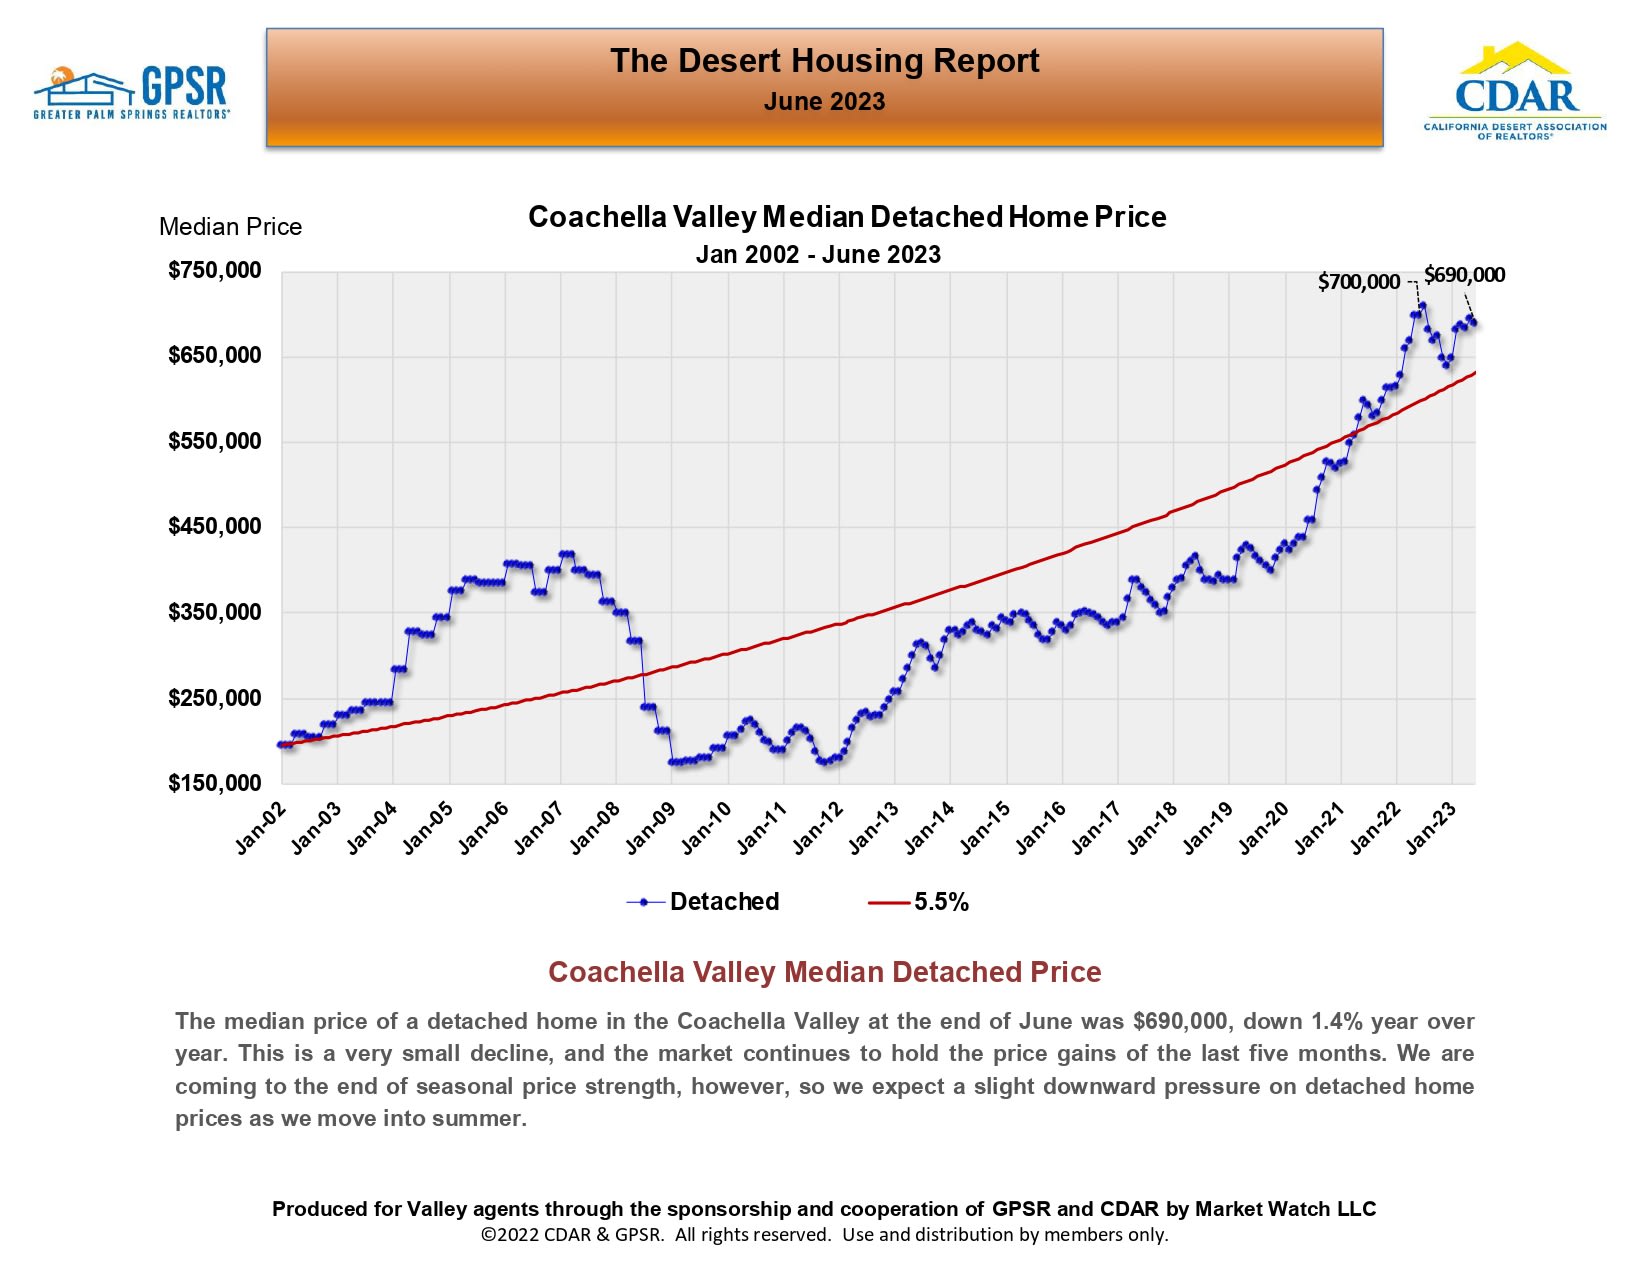
Chart of Coachella Valley detached home prices, January 2002–June 2023, ending at $690,000.

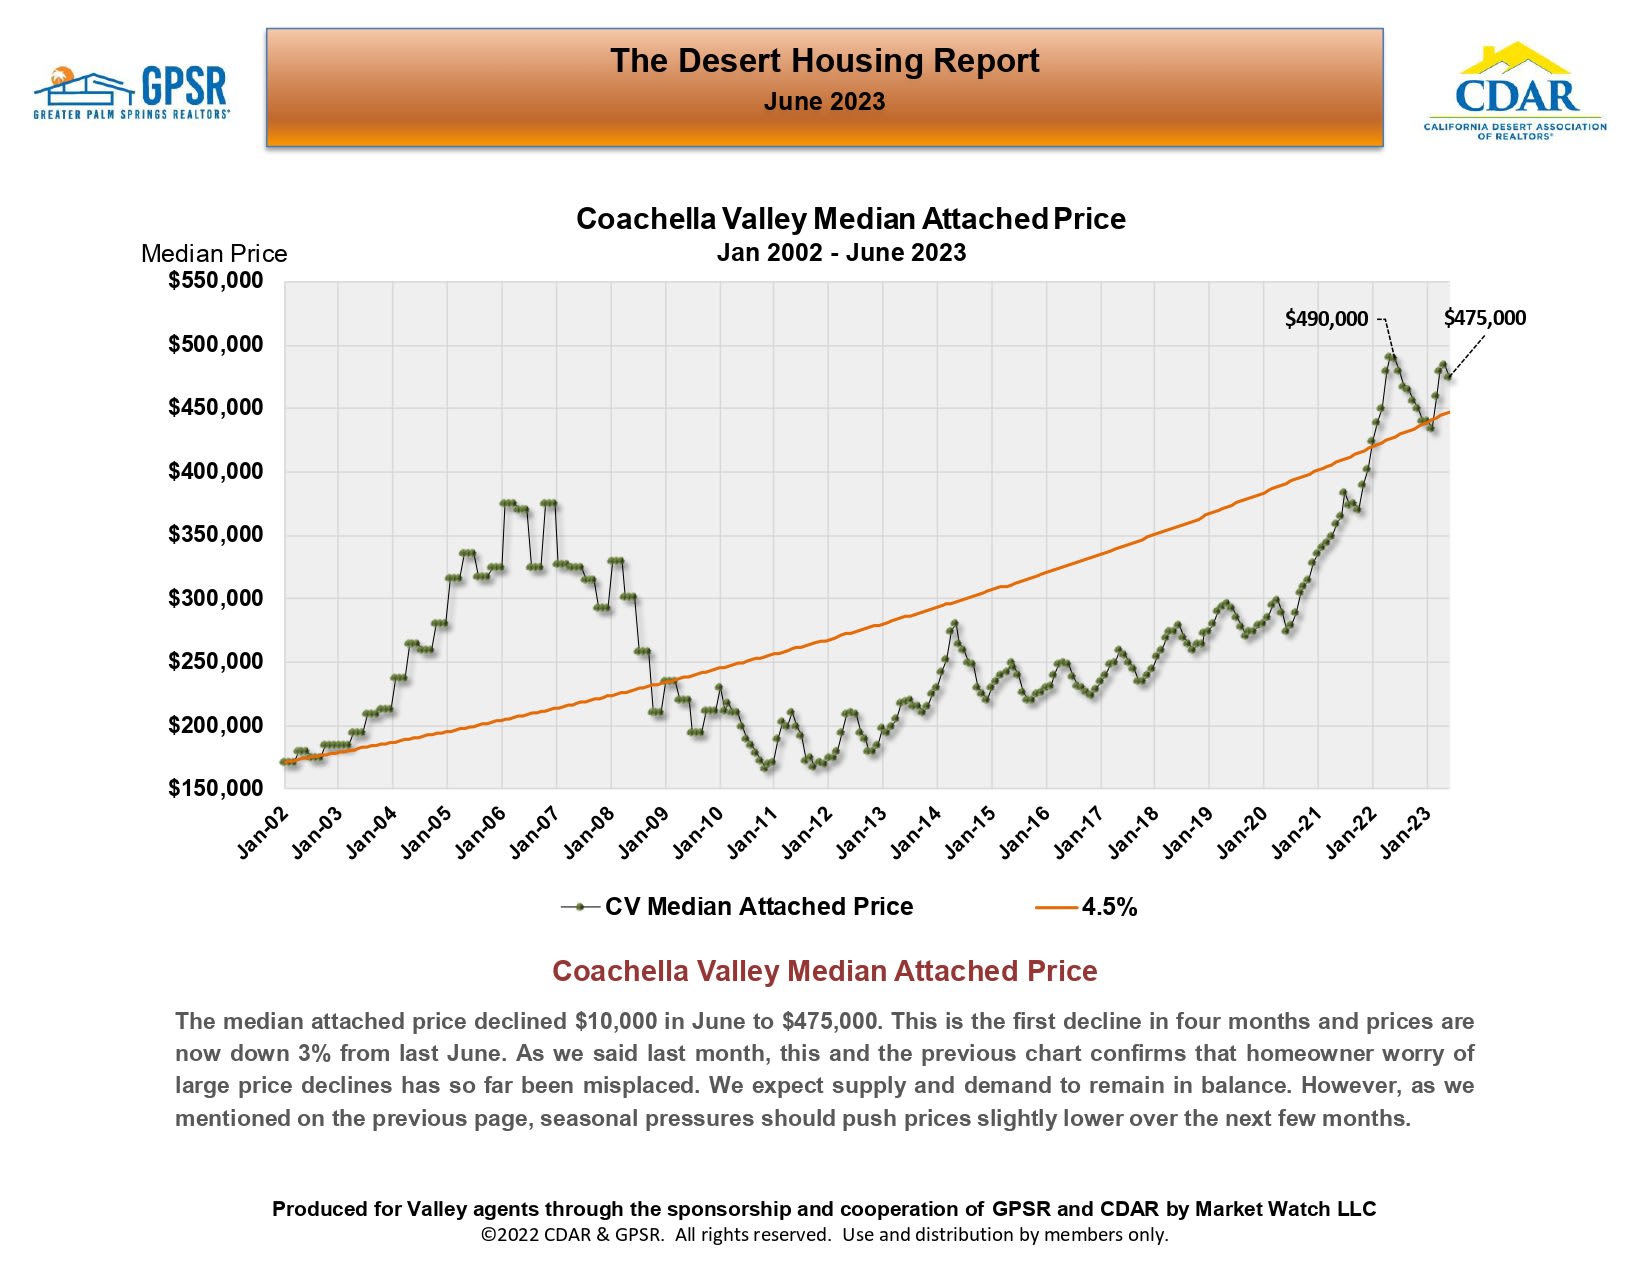
Chart of Coachella Valley median attached prices, ending at $475,000 in June 2023, with a 4.5% trend line.

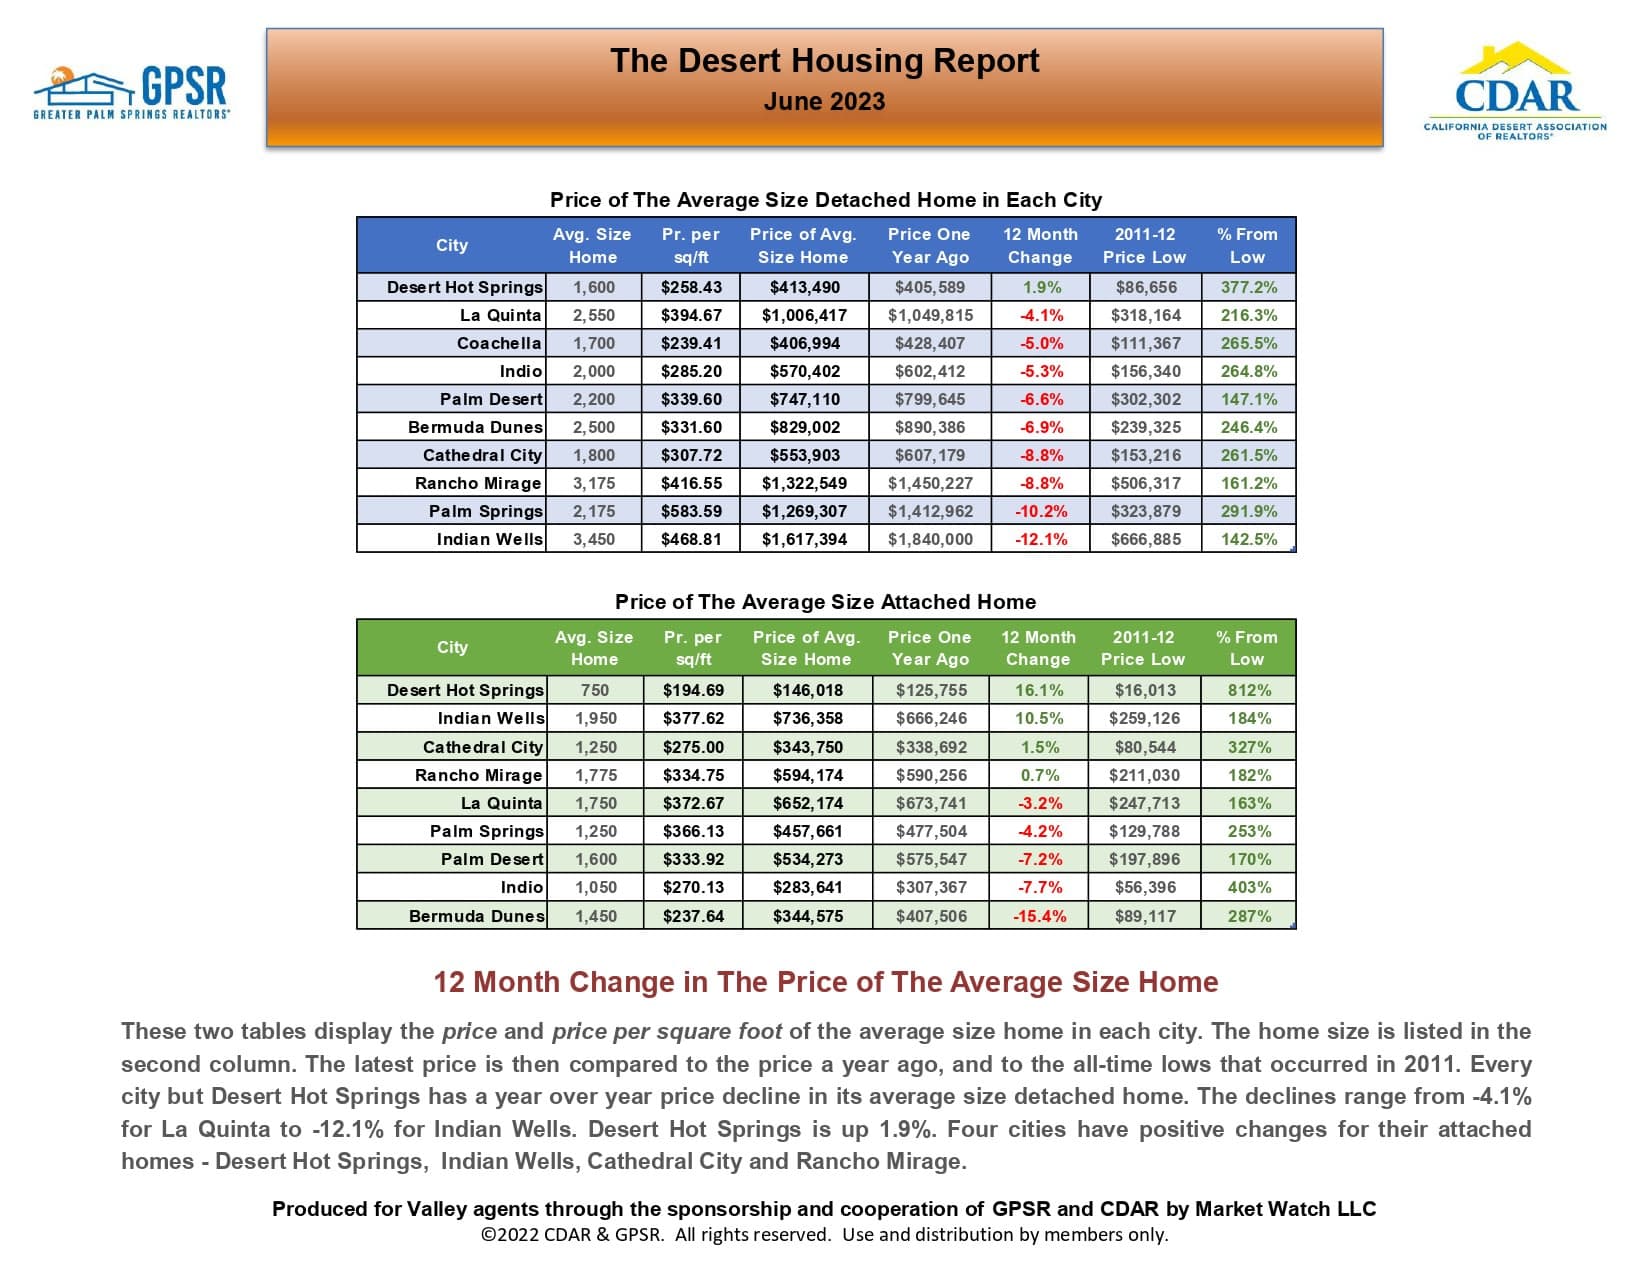
June 2023 Desert Housing Report compares detached and attached home prices across Palm Springs-area cities.

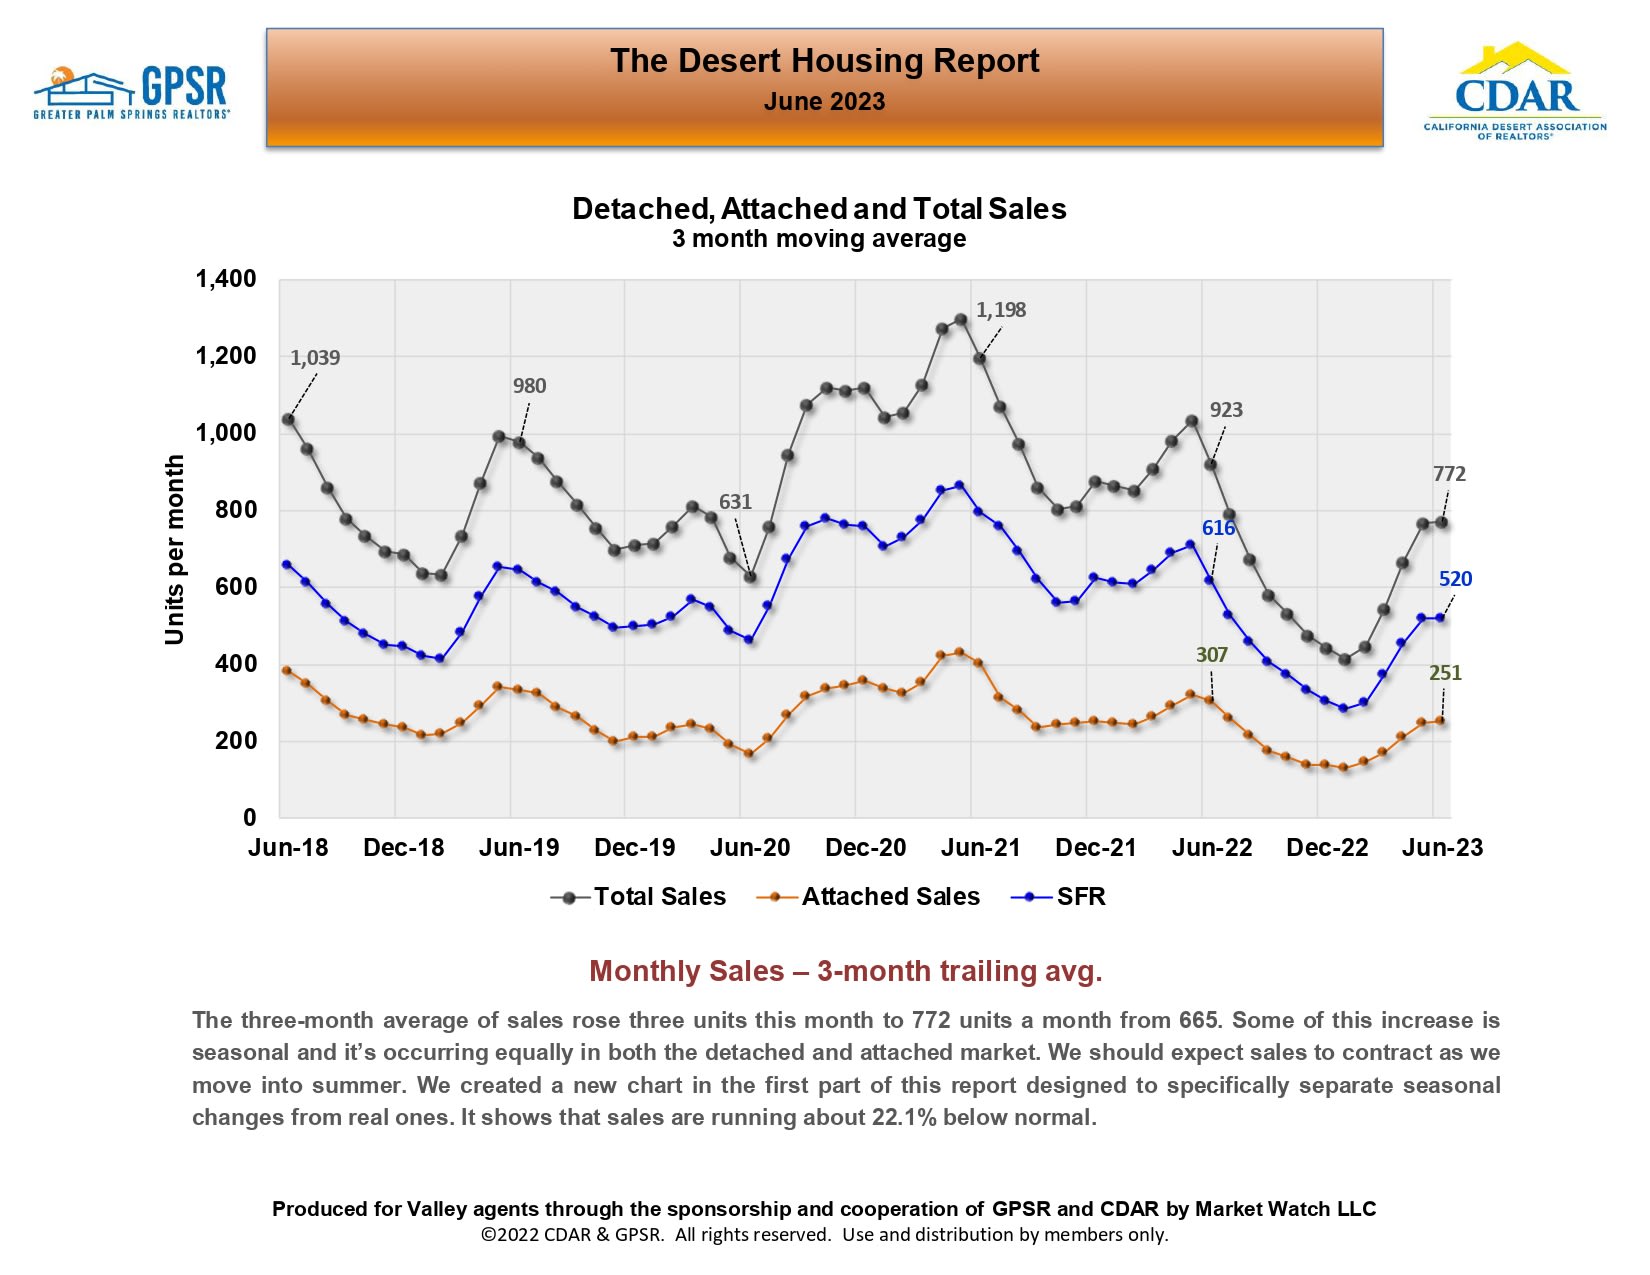
Desert Housing Report chart showing monthly detached, attached, and total home sales from 2018 to 2023.

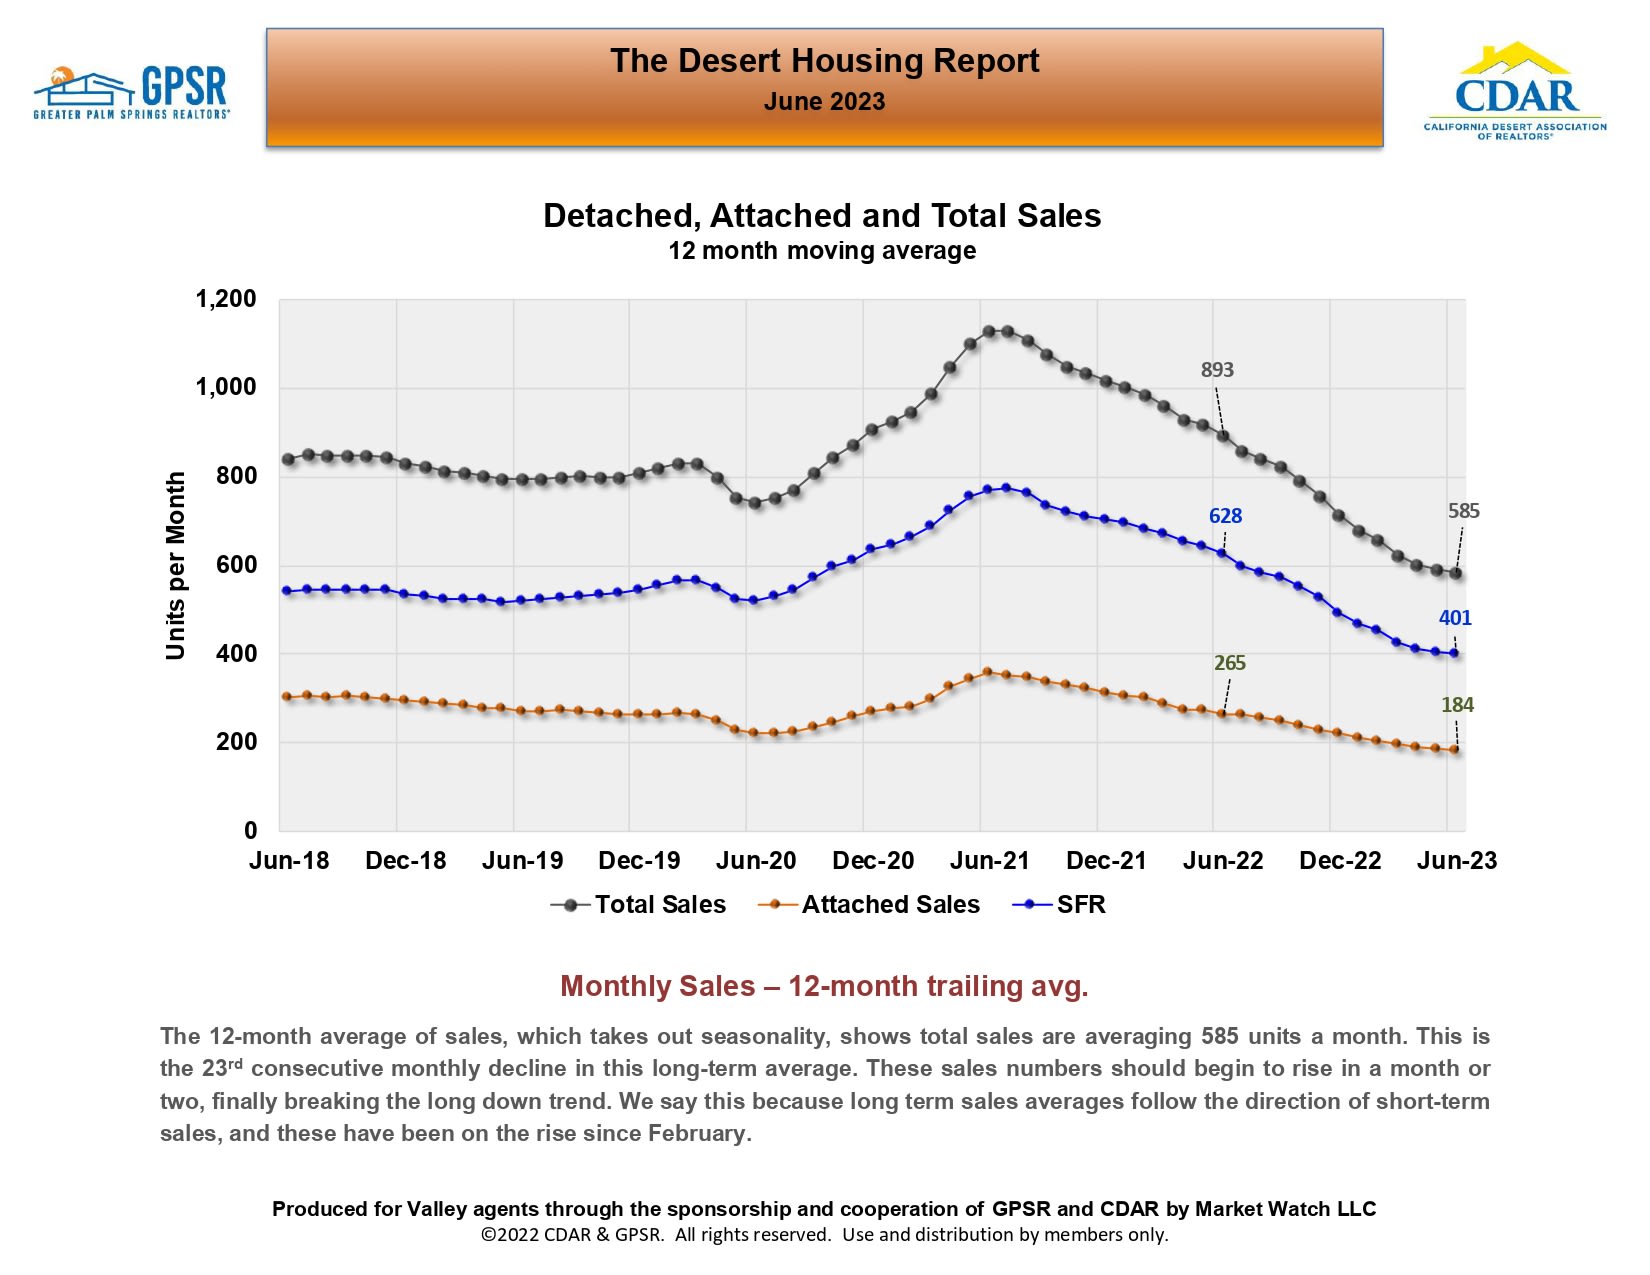
Chart of June 2023 Desert Housing Report sales averages, with total sales declining to 585 units per month.

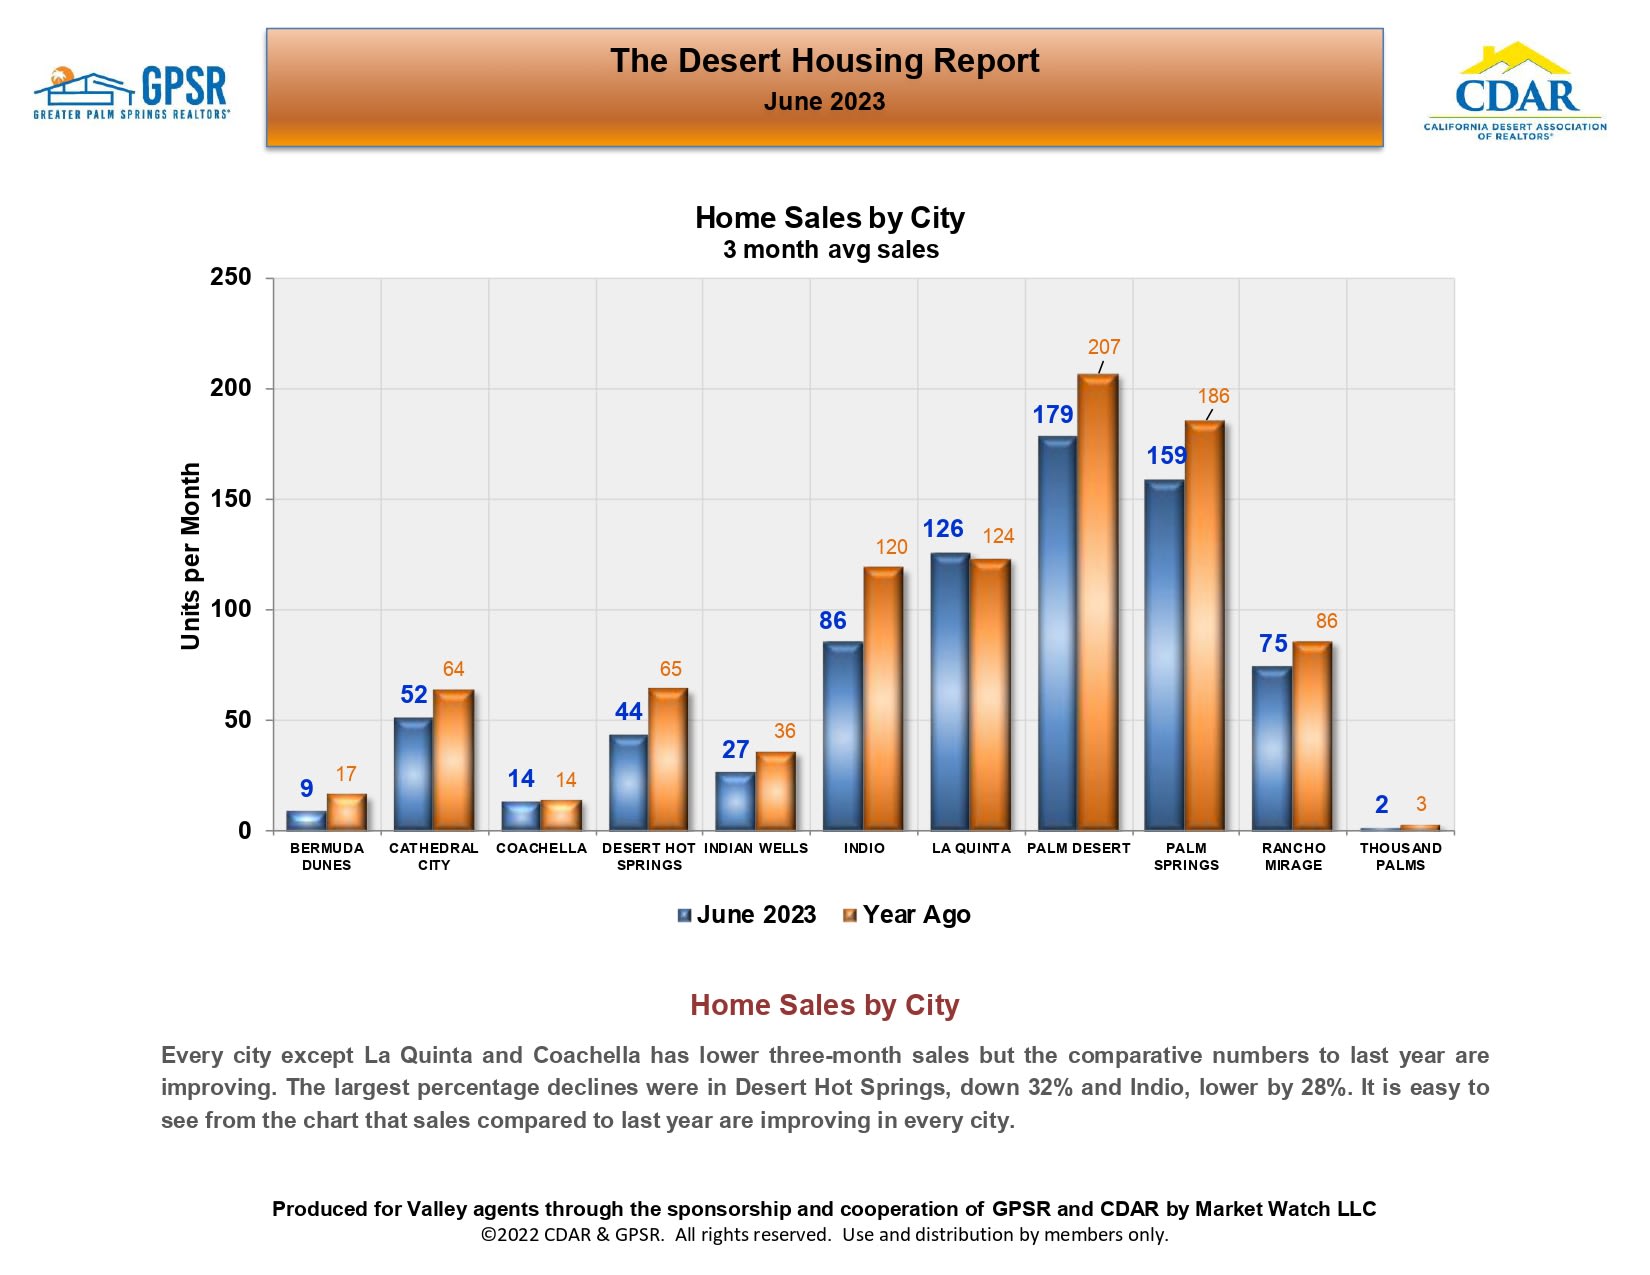
Bar chart comparing June 2023 and year-earlier average monthly home sales across 11 desert cities.

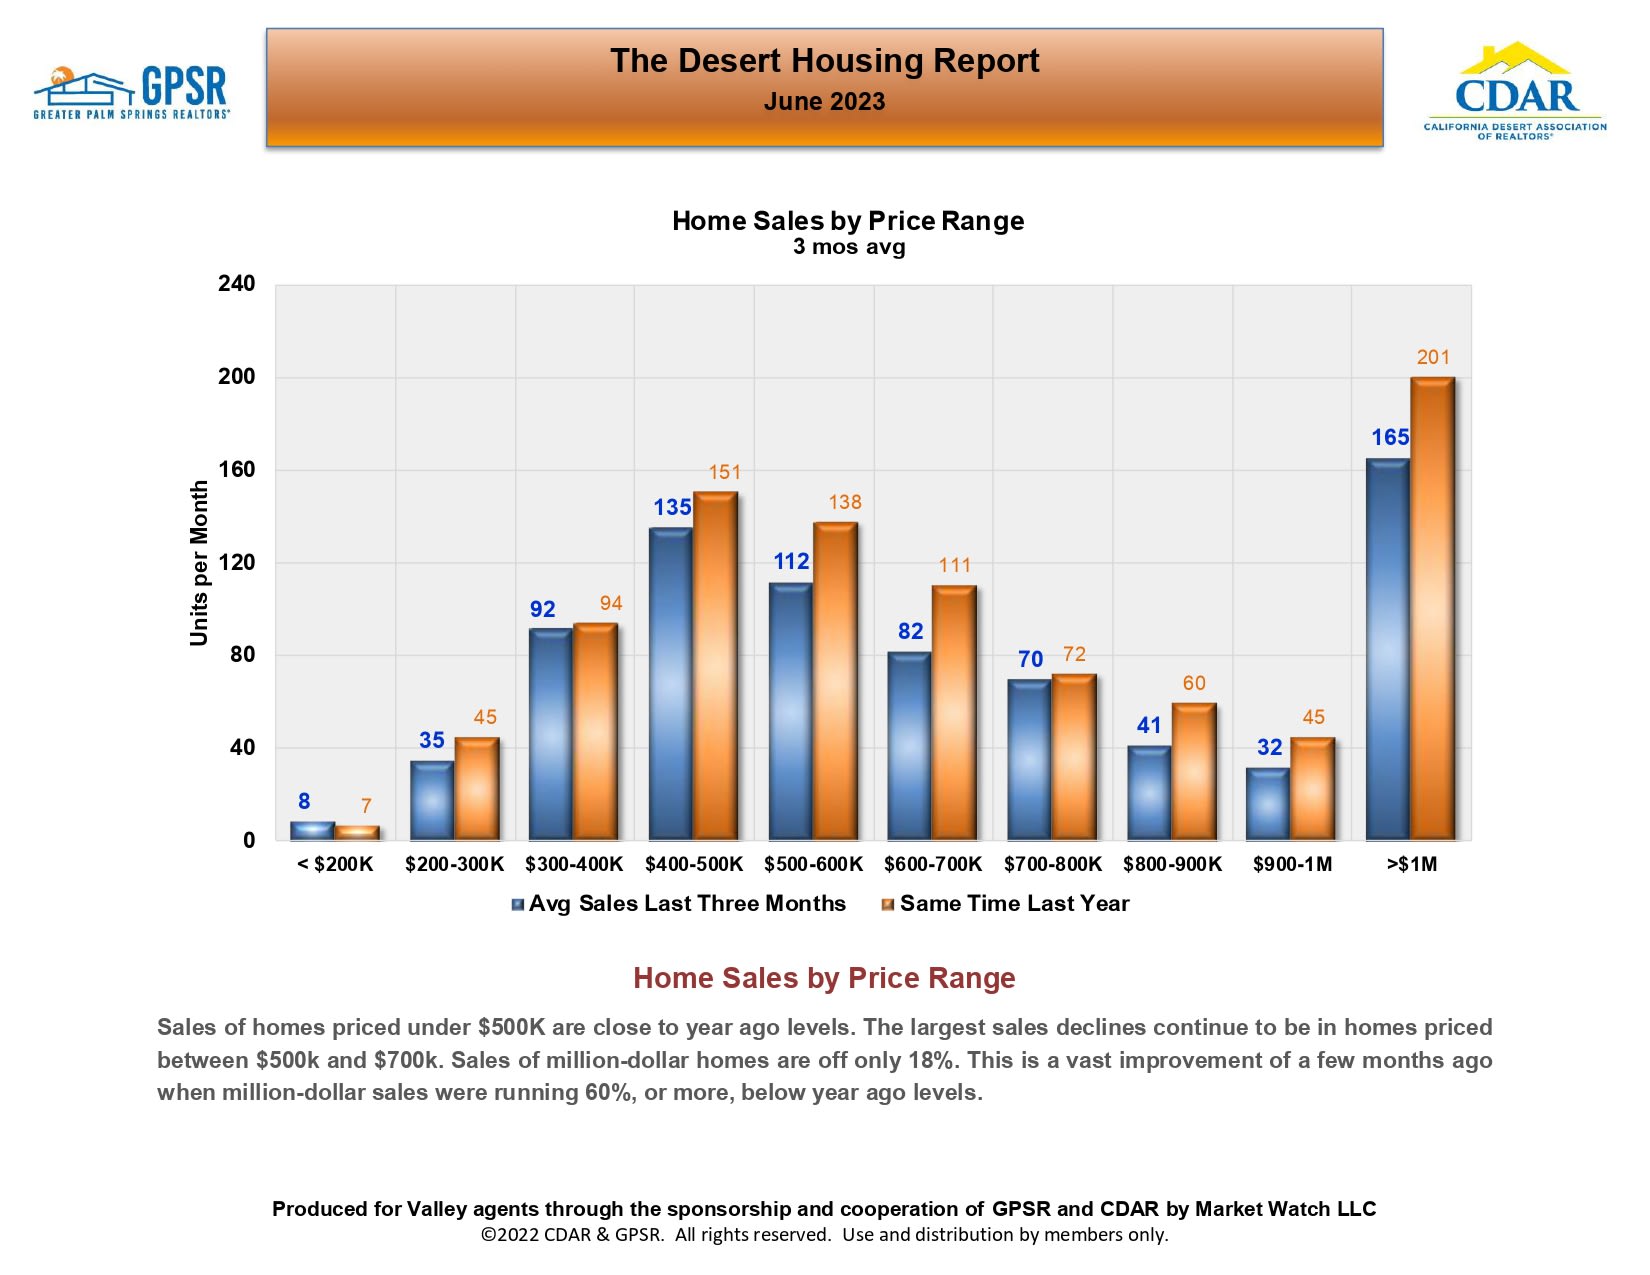
June 2023 Desert Housing Report chart comparing recent monthly home sales with the same time last year by price range.

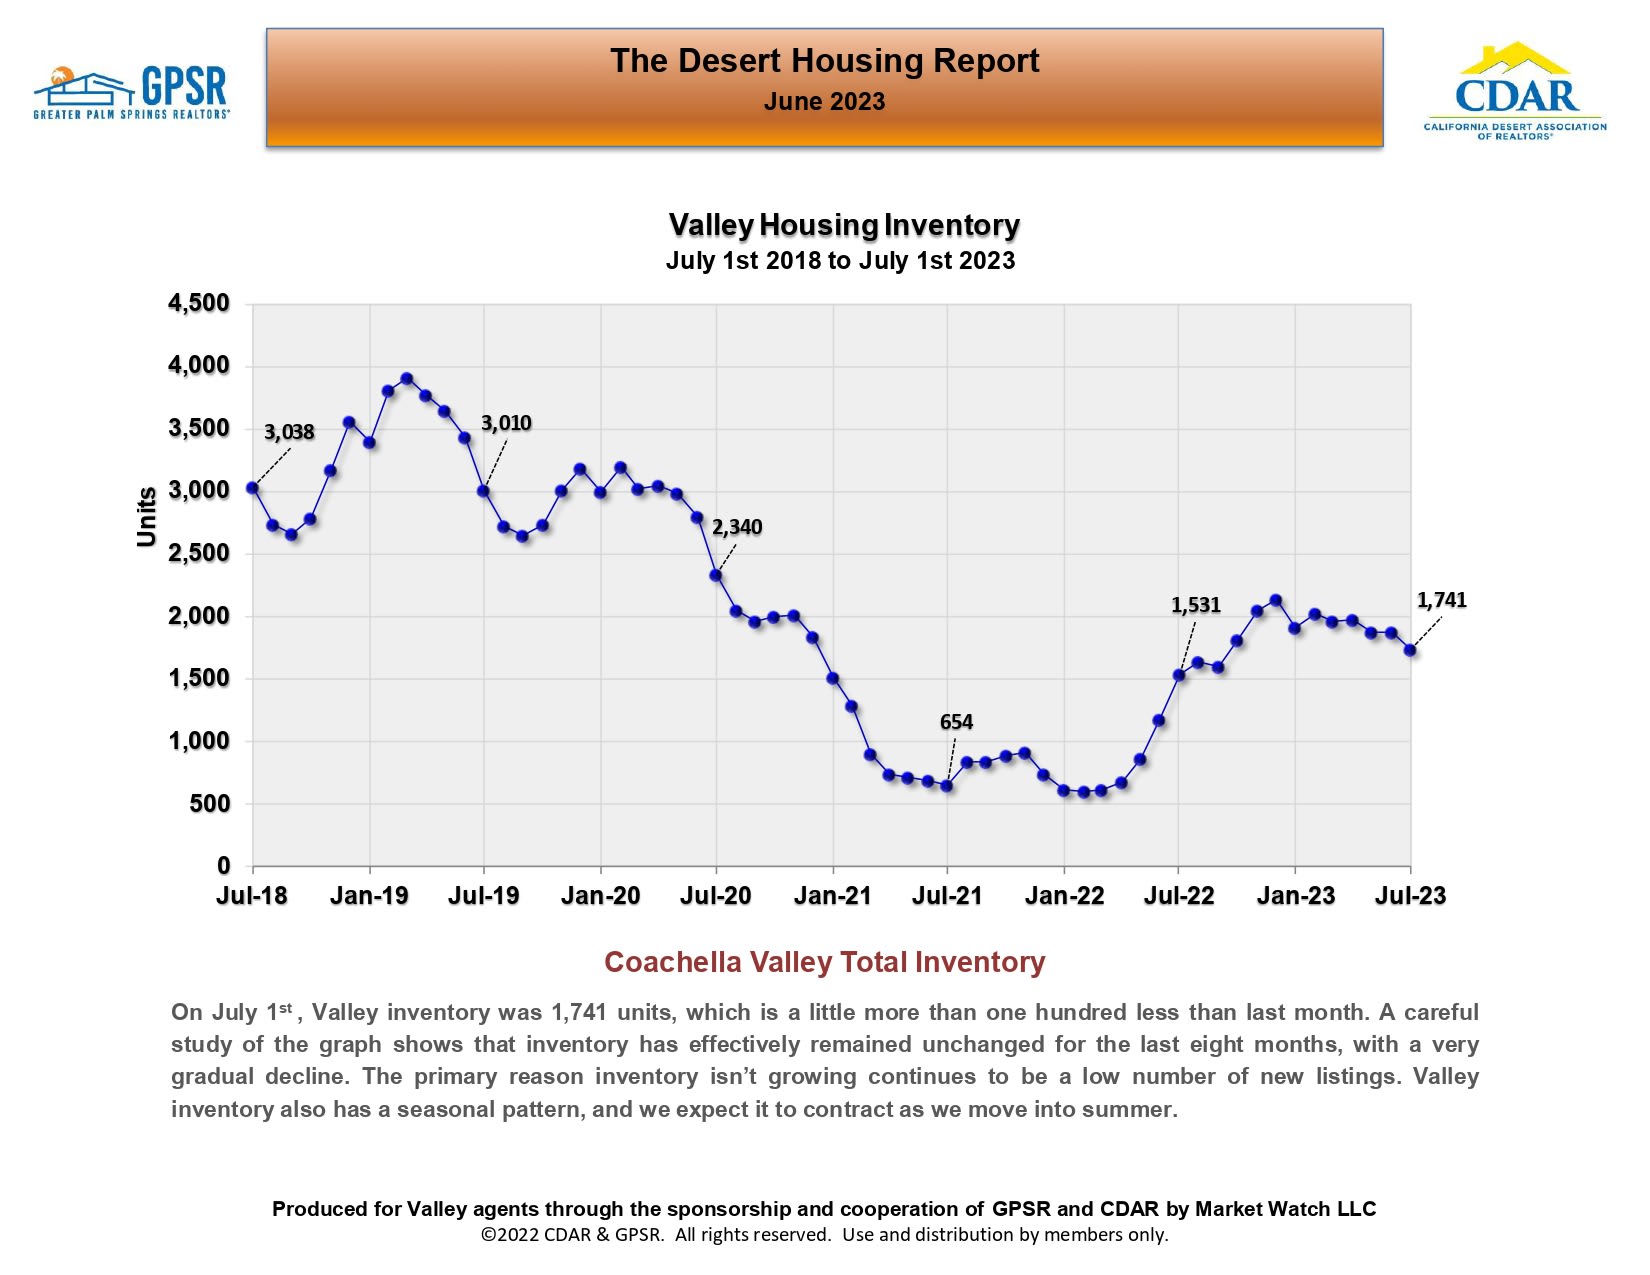
Coachella Valley housing inventory chart, showing 1,741 units in July 2023 after a low of 654 in July 2021.

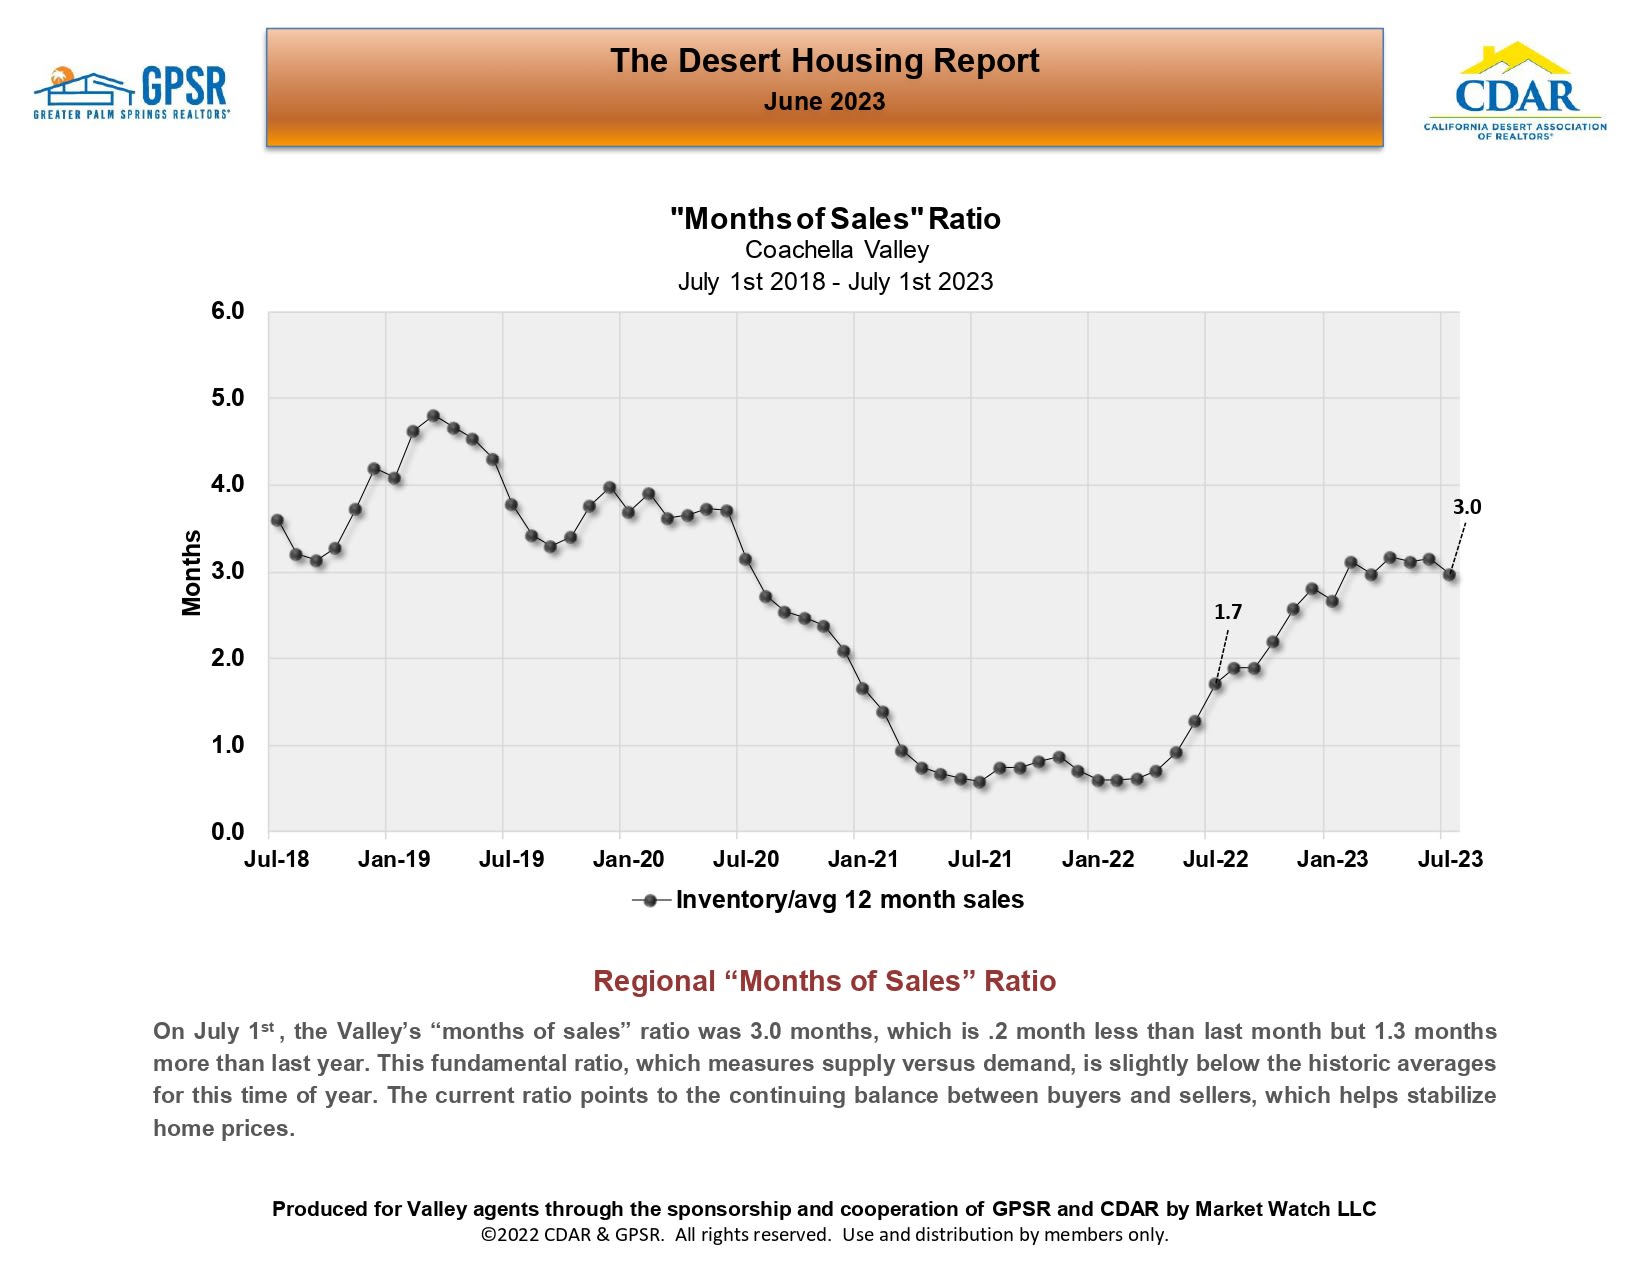
Coachella Valley months-of-sales chart, showing the ratio rising to 3.0 months by July 2023.

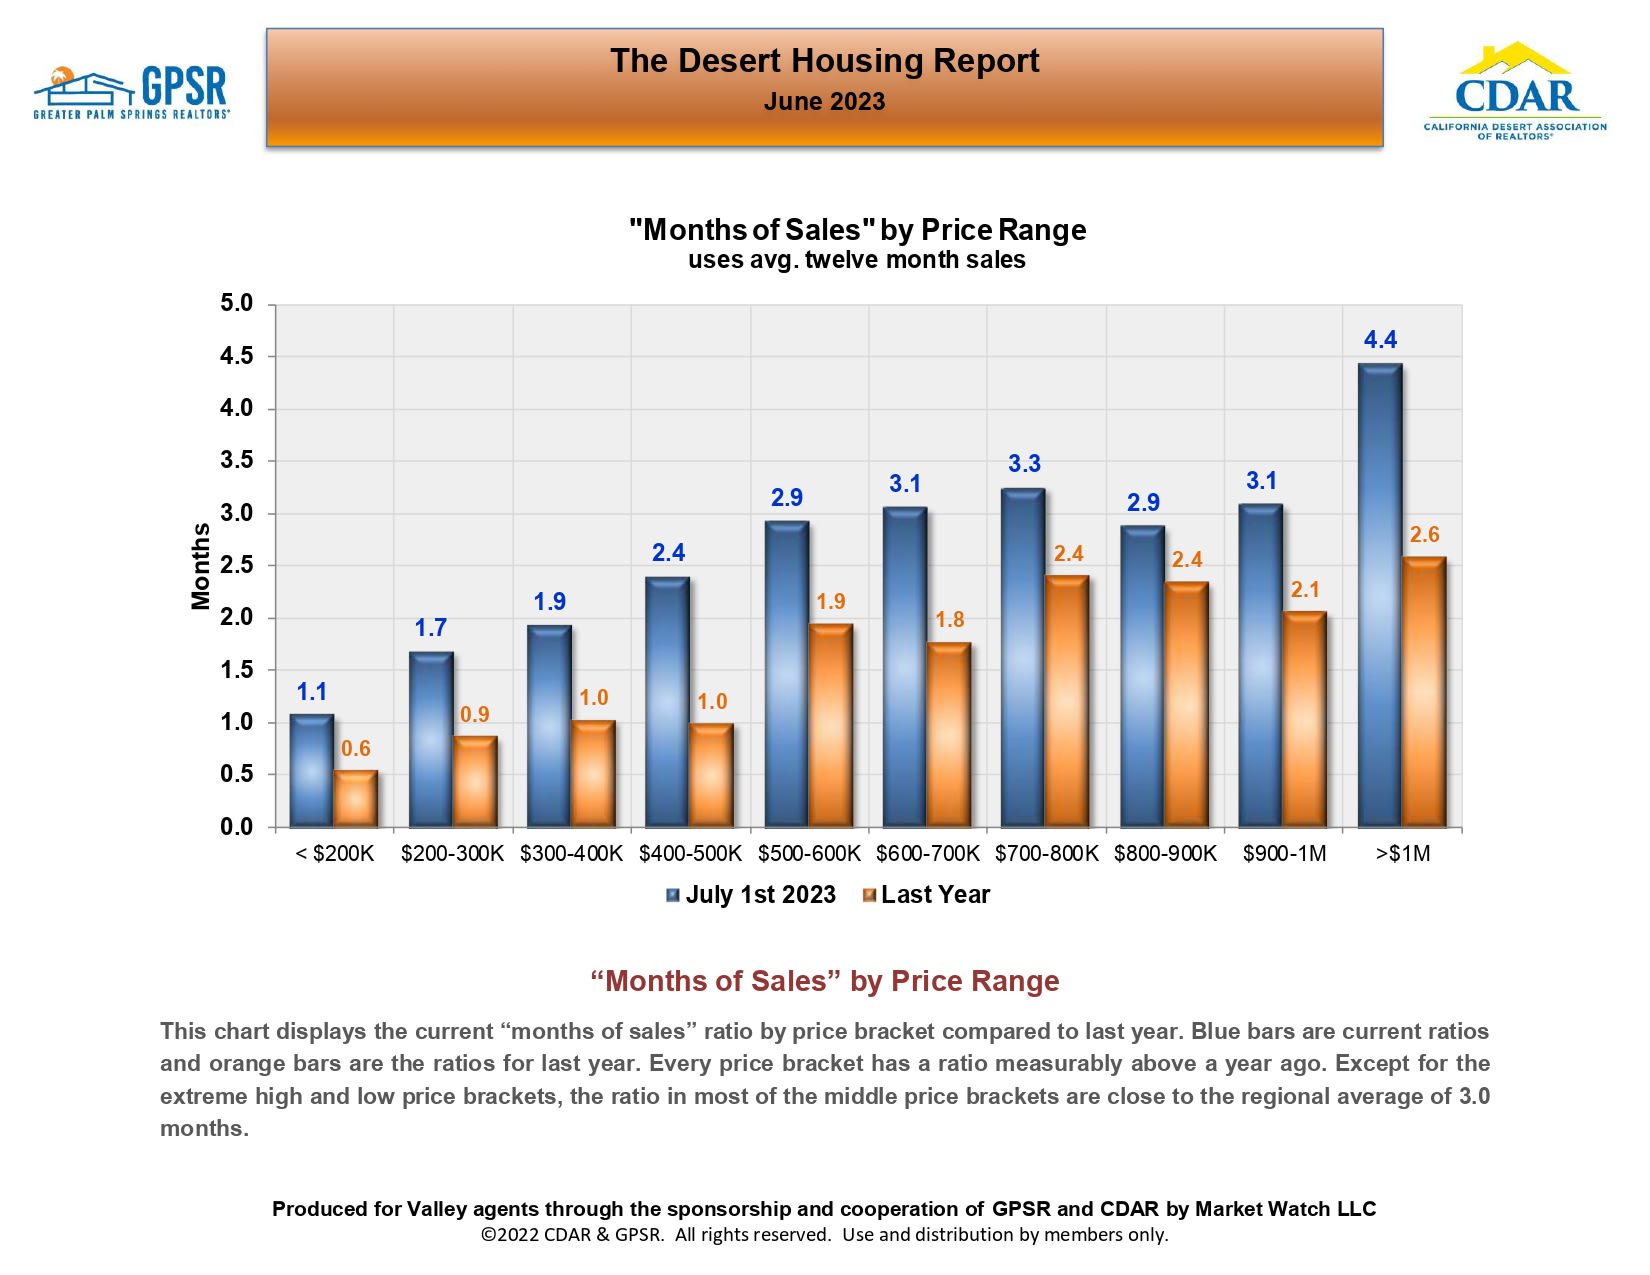
Chart comparing months of housing sales by price range in July 2023 and the previous year.

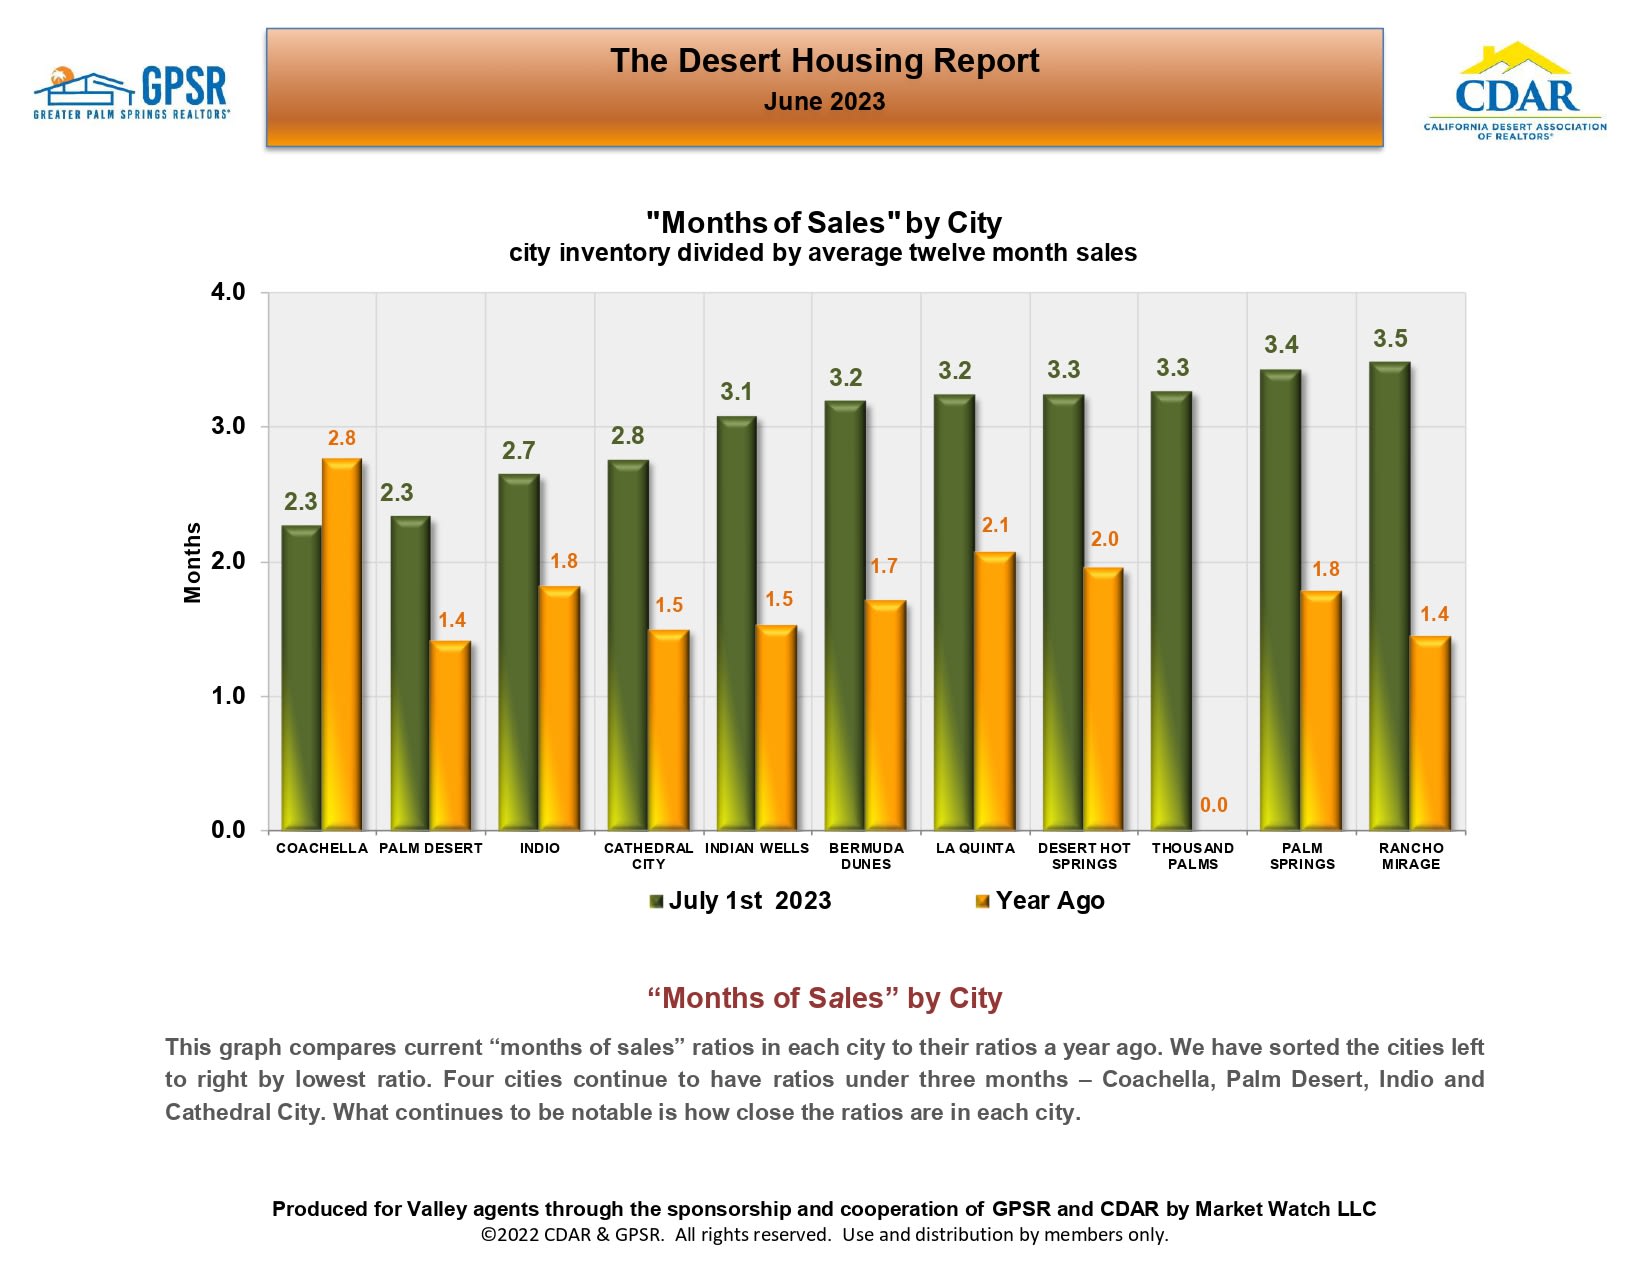
Bar chart comparing current and year-ago months of home sales inventory across 11 desert cities.

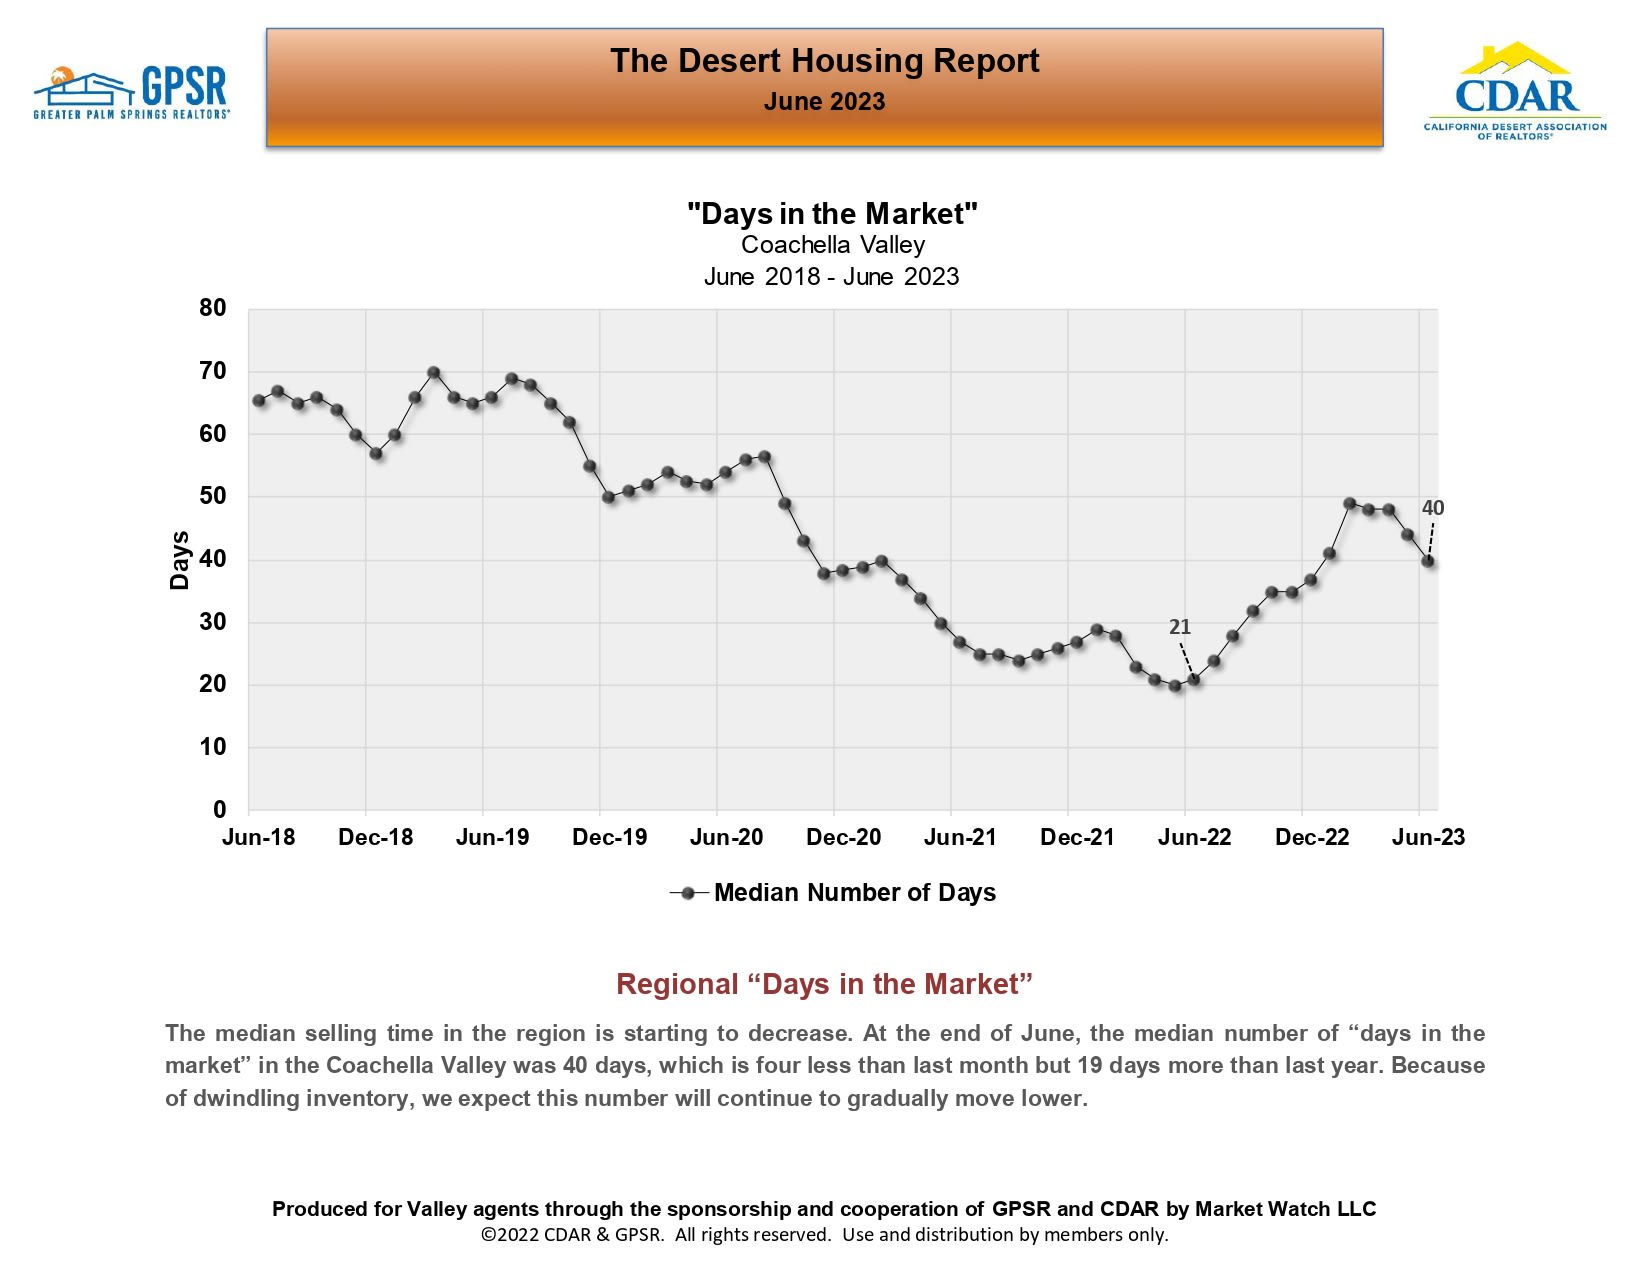
Coachella Valley median days-in-market chart, June 2018–June 2023, ending at 40 days.

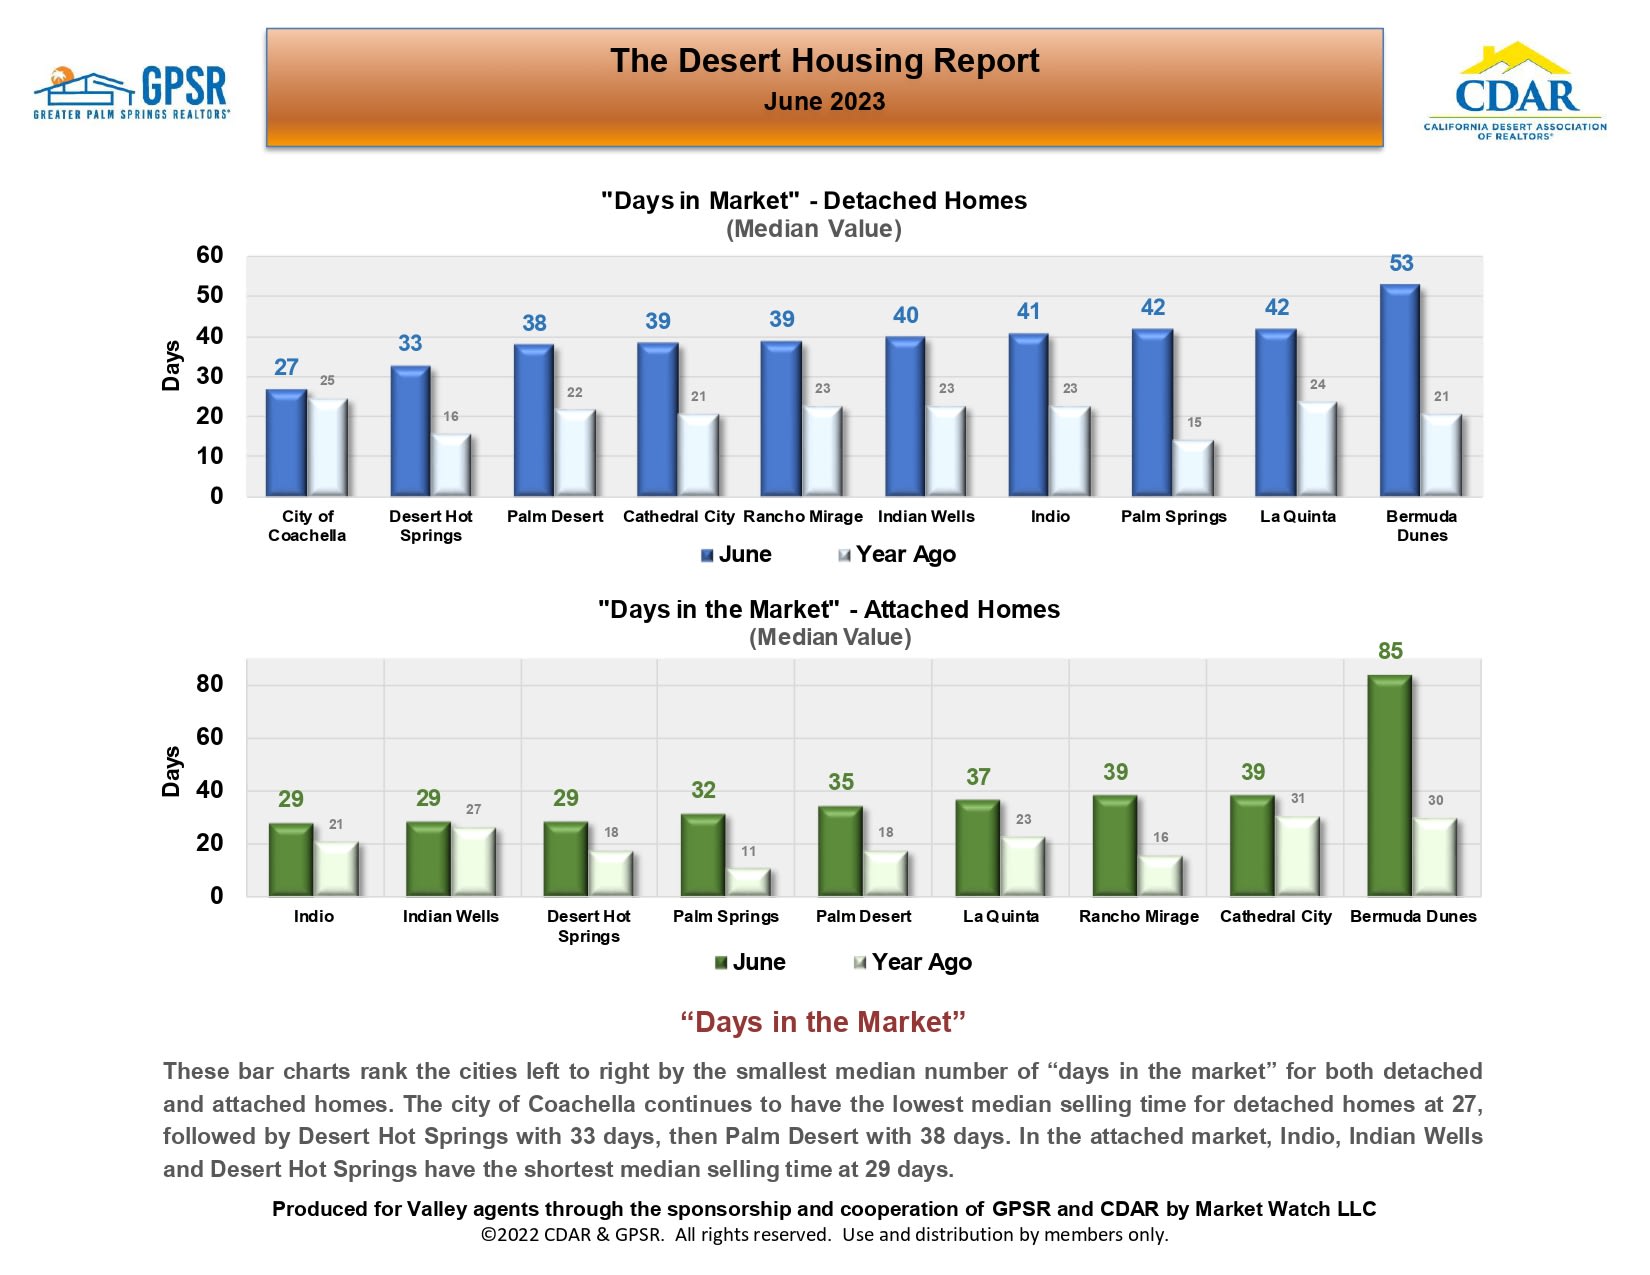
June 2023 Desert Housing Report charts compare median days on market for detached and attached homes across desert cities.

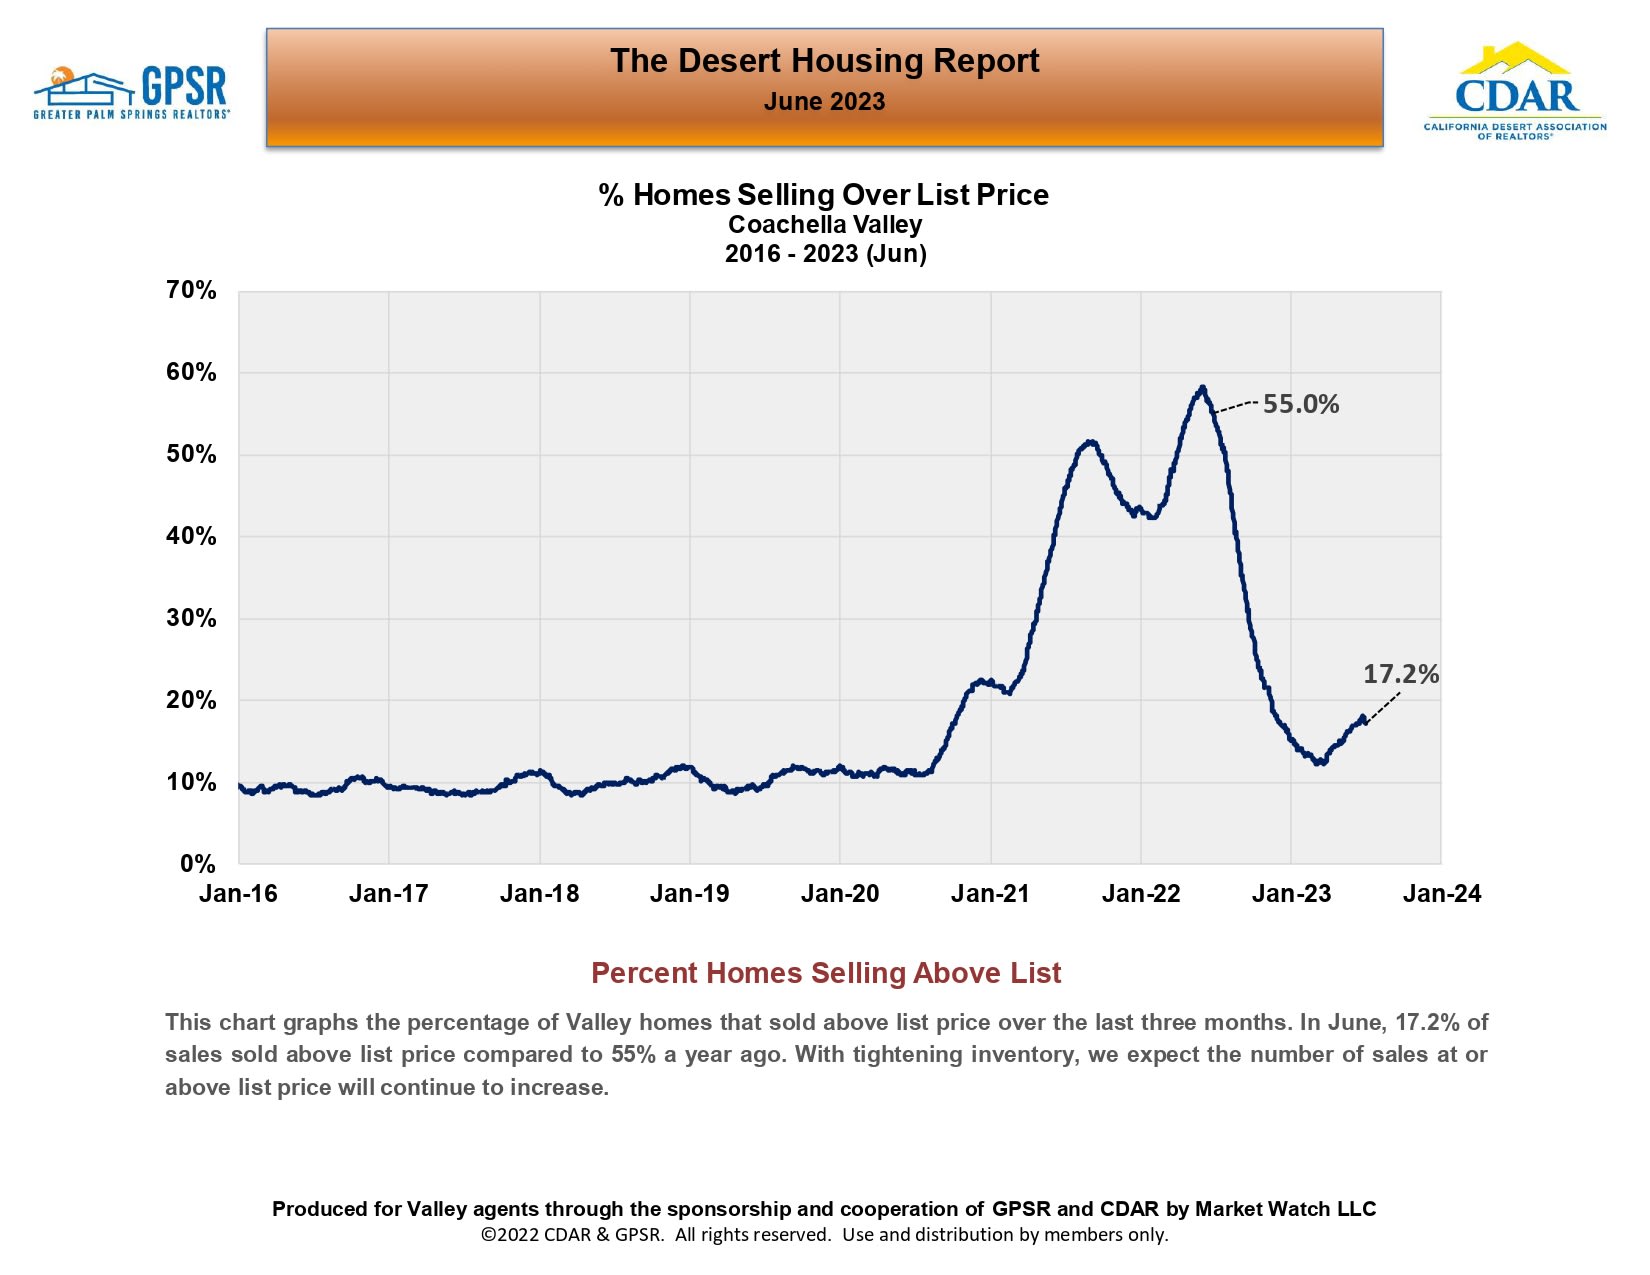
Chart of Coachella Valley homes selling above list price, ending at 17.2% in June 2023.

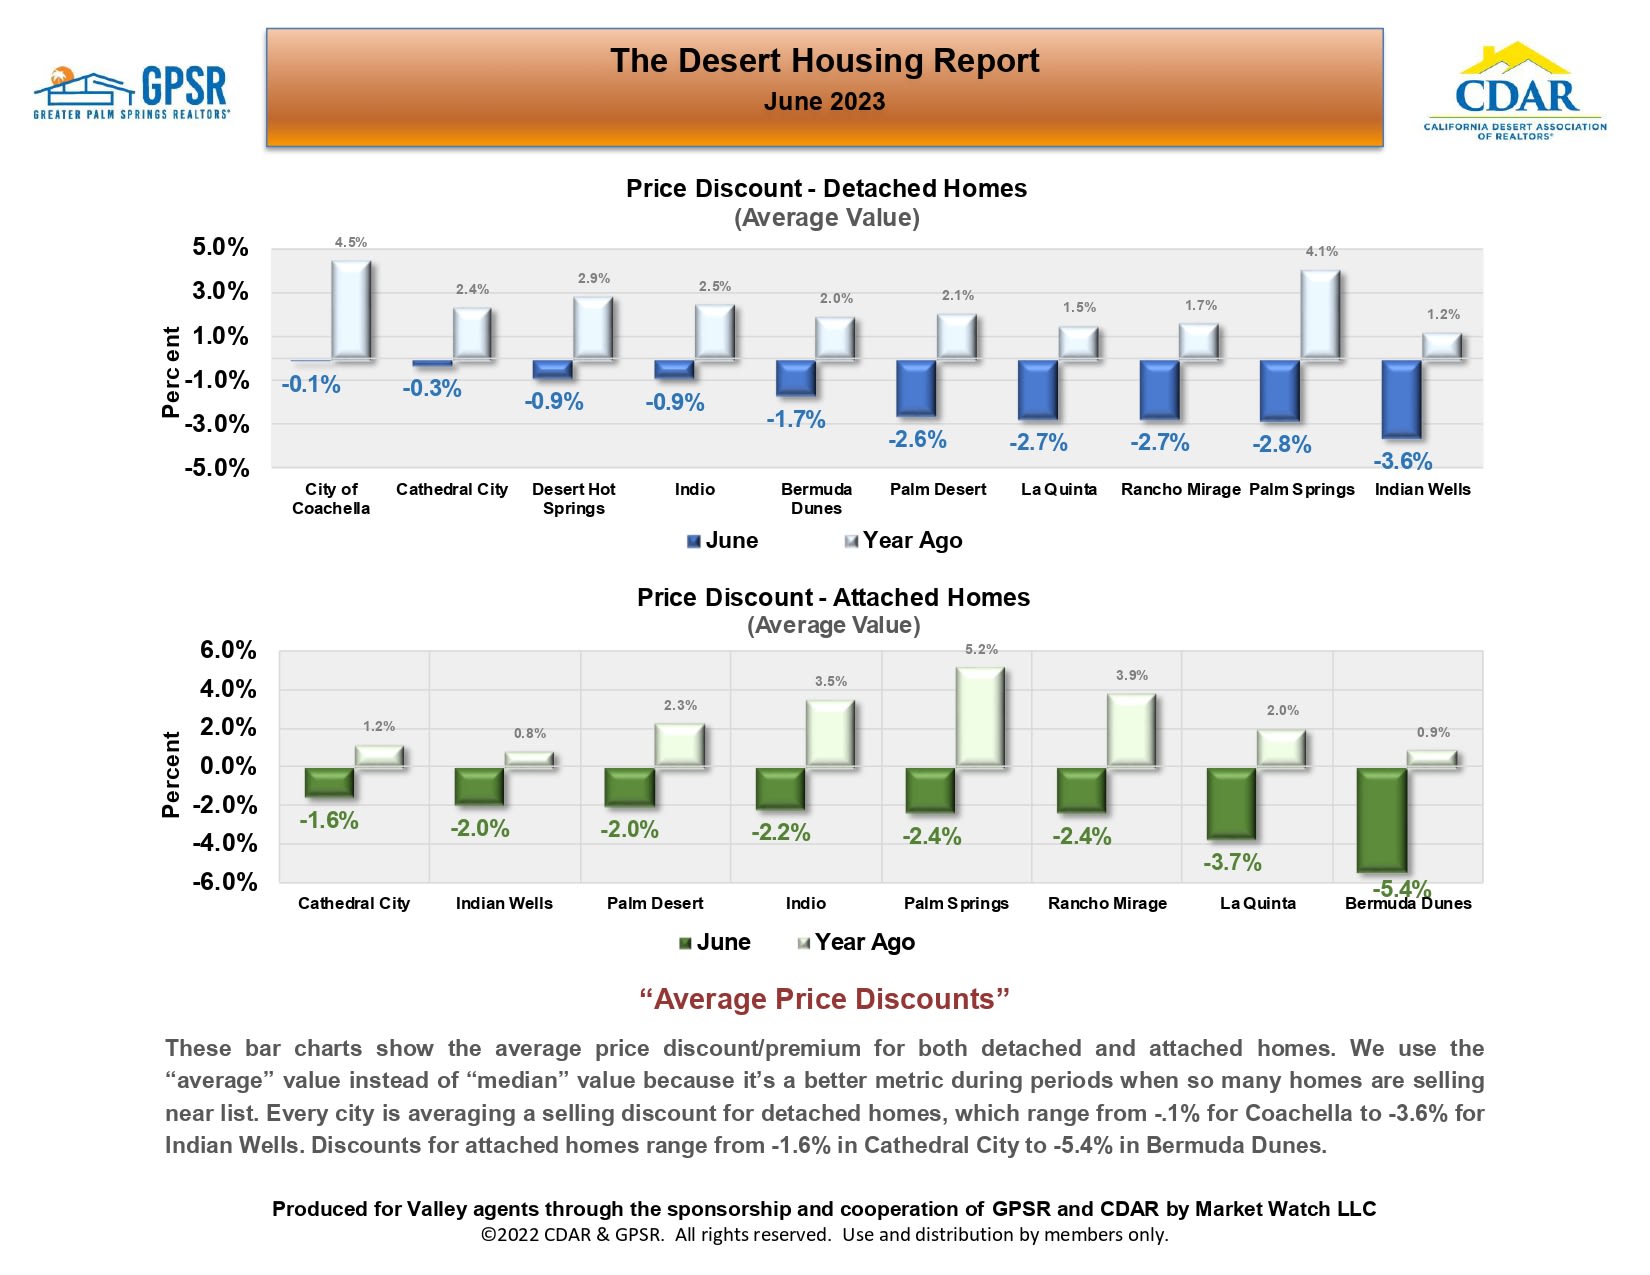
June 2023 Desert Housing Report charts comparing detached and attached home price discounts across Coachella Valley cities.

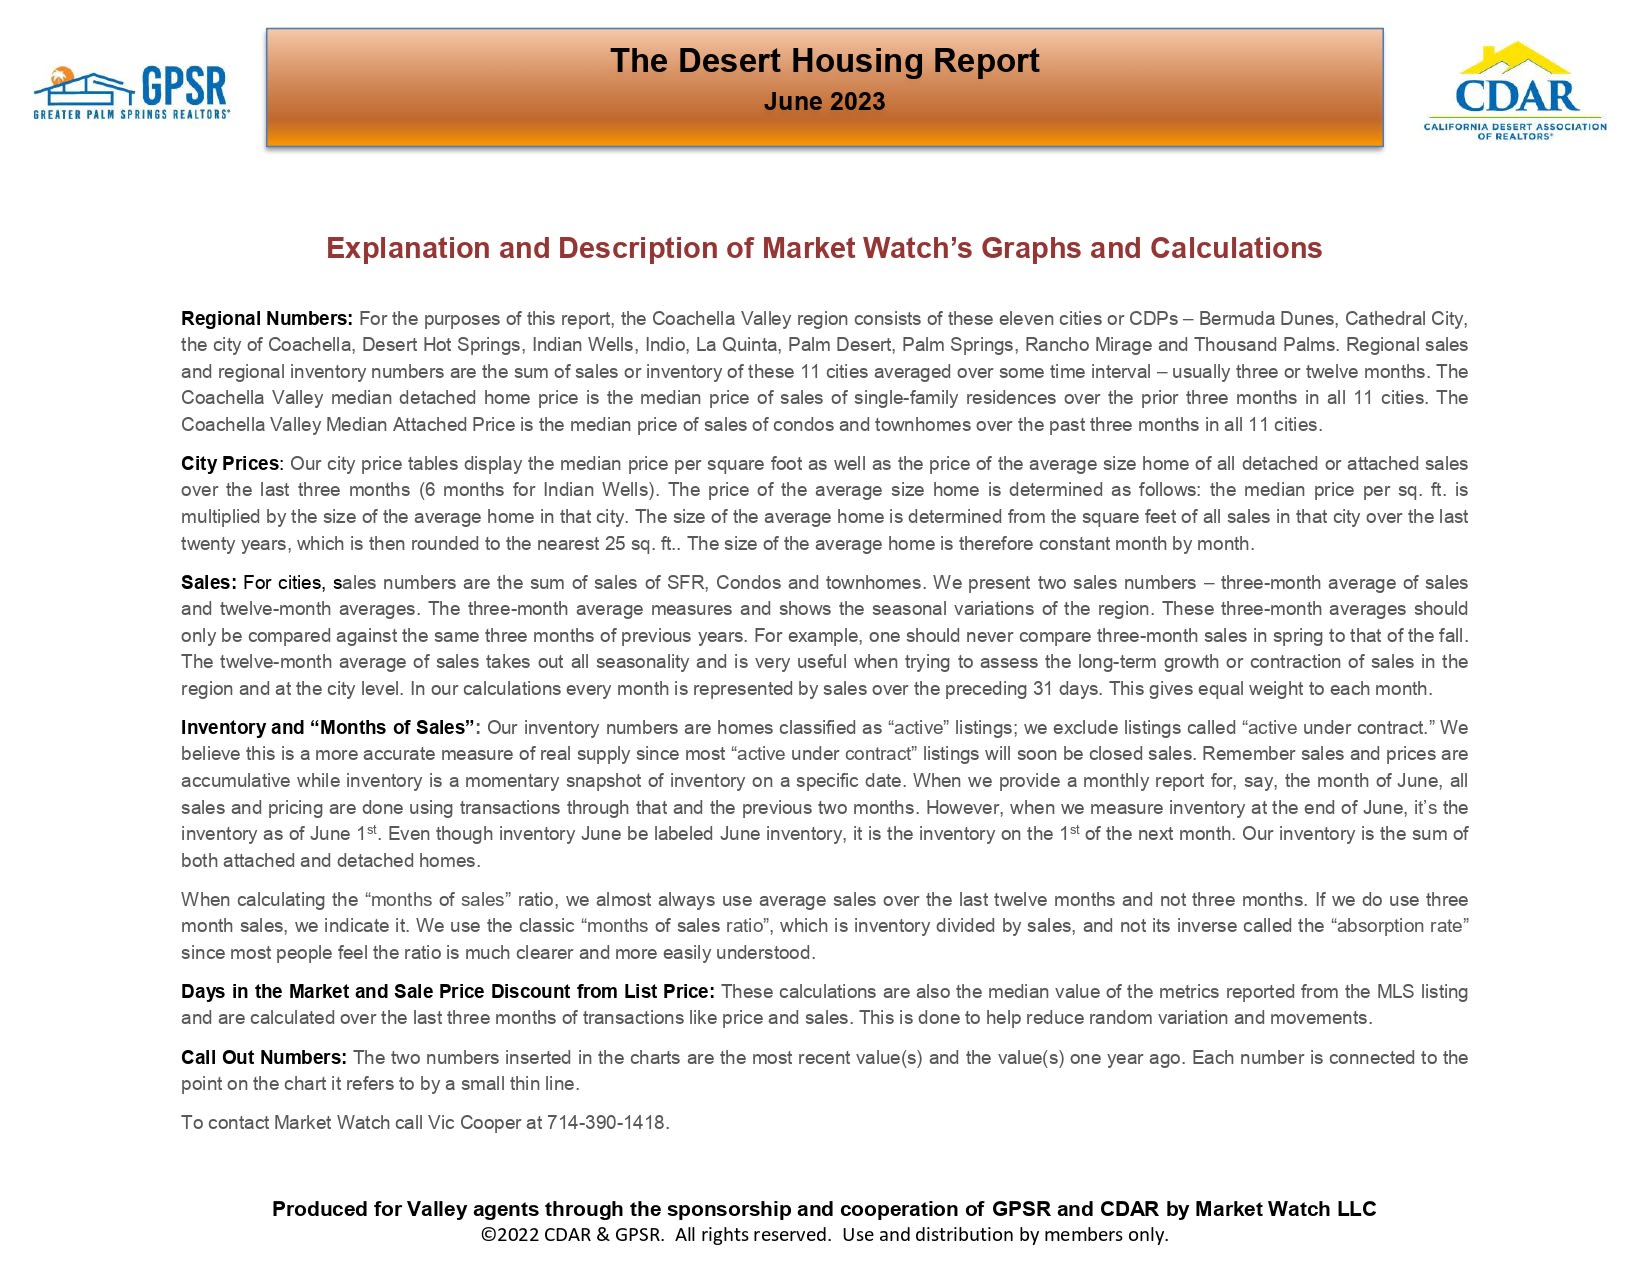
June 2023 Desert Housing Report page explaining Market Watch’s graphs and calculations.


Work With Michelle

Michelle is an E-Pro, Certified Luxury Home Specialist and has been recognized several years in a row as a top producer. Her clients find her patient, knowledgeable, dedicated, and willing to offer honest advice.

Follow Michelle on Instagram